| ♥ 0 |
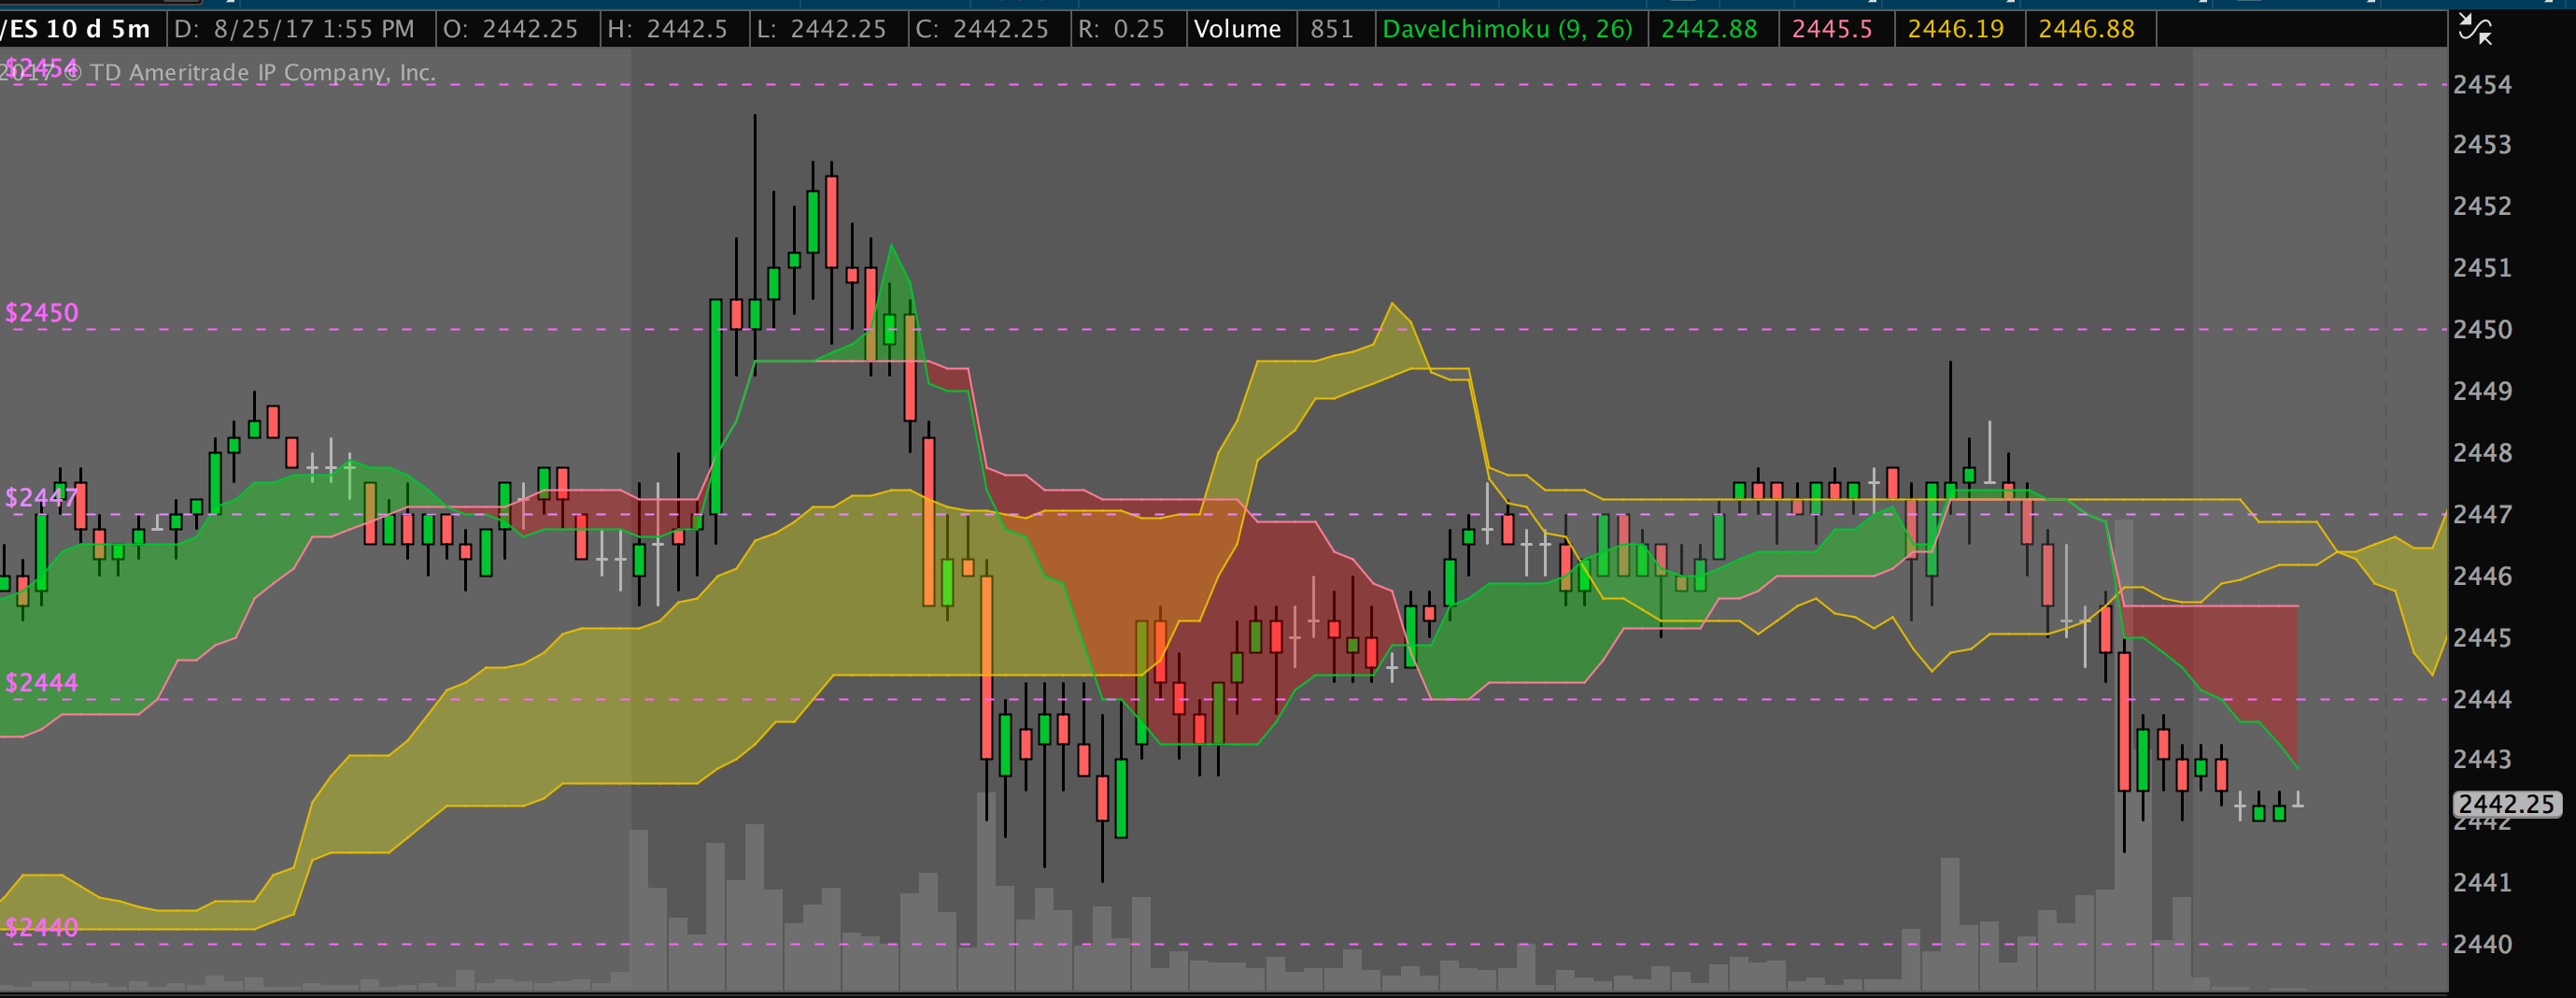
Hi Pete, Just found your site, and wow, just wow….so very informative, thank you! My question seems simple enough, but having never written any type code, I wonder how I might be able to put user defined horizontal lines on my charts w/o using the drawing tool as I’m doing now…that get deleted if I ever want to clear my drawing set to remove everything else, but not having to click on each one individually to avoid clearing all my horizontal support and resistance lines. Something along the dashed lines on the attached chart that I added the horizontal lines with the drawing tool, but hopefully be able to enter them as a study that I could update with additional lines as I saw new ones develop, so I can clear my charts of all my other drawings with one click, and while still keeping the horizontal lines on the chart. Thanks in advance for any thoughts, or help…and a special thanks for the great site, Dave PS. My apologies if this has already been asked and answered, but the only thing I could find that was close, was the “Horizontal Lines Ichimoku”, and I tried to find the “horizontal line” part of that formula, was just left me scratching my head as which code lines to copy, and try. =( Attachments:
Marked as spam
Asked on August 27, 2017 2:56 pm
7014 views
|