Translate TradeStation version of ADX to TOS


Category:
0
0

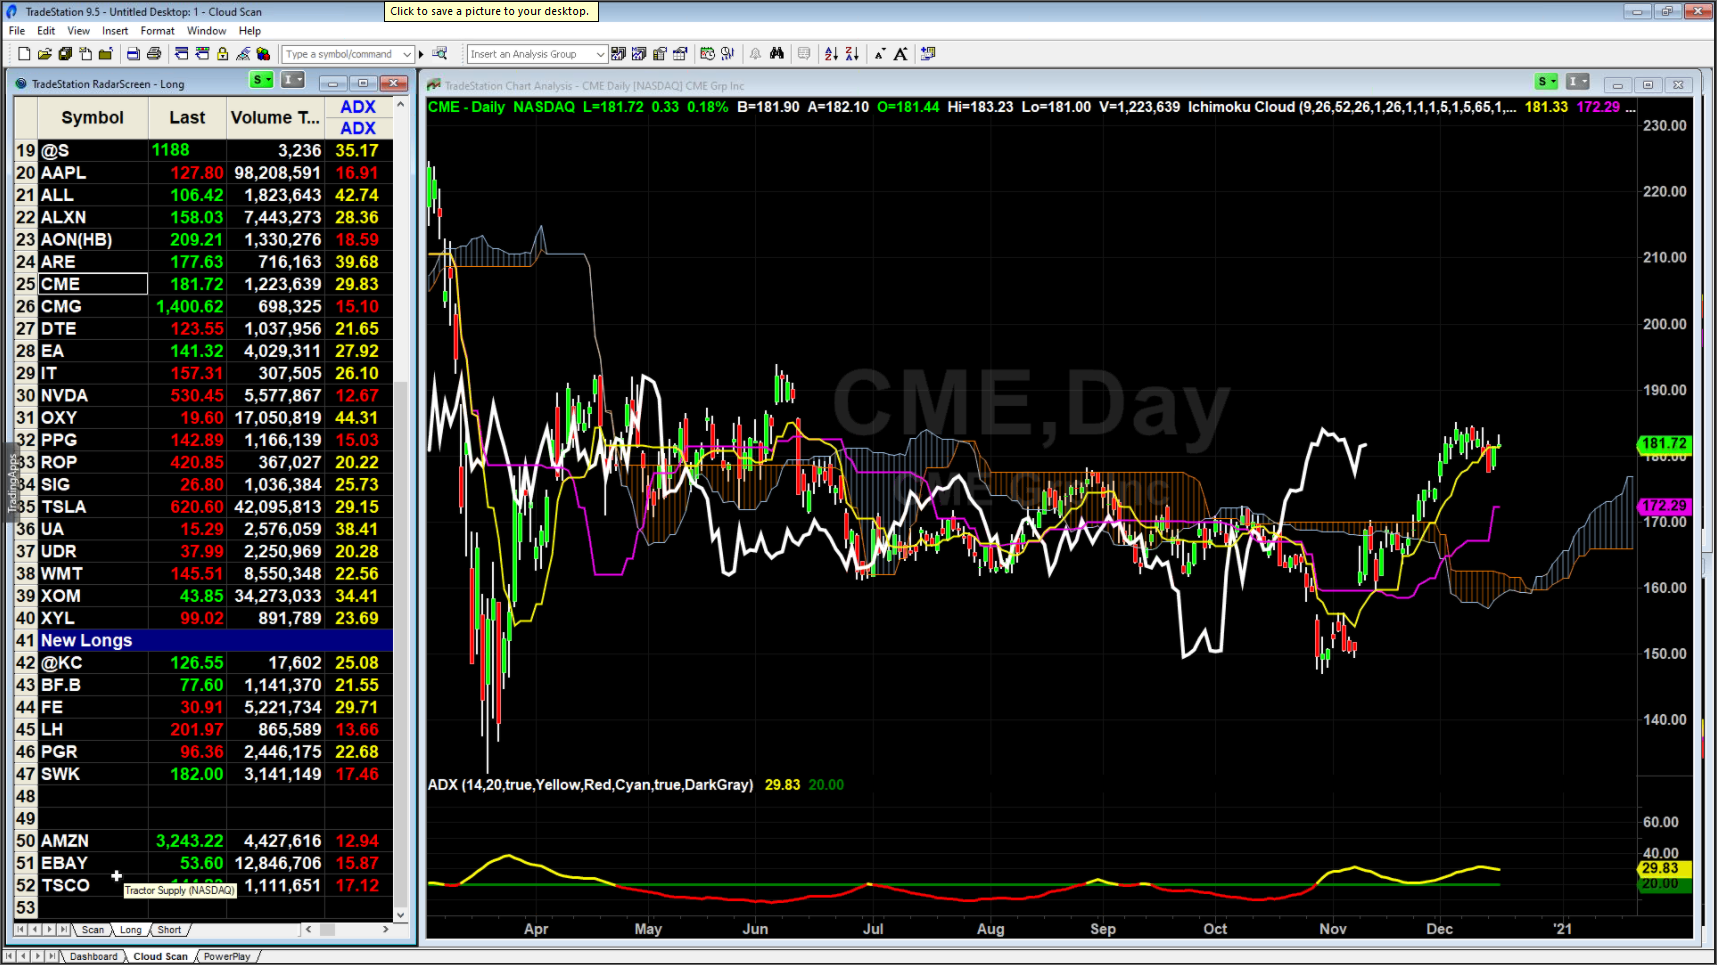
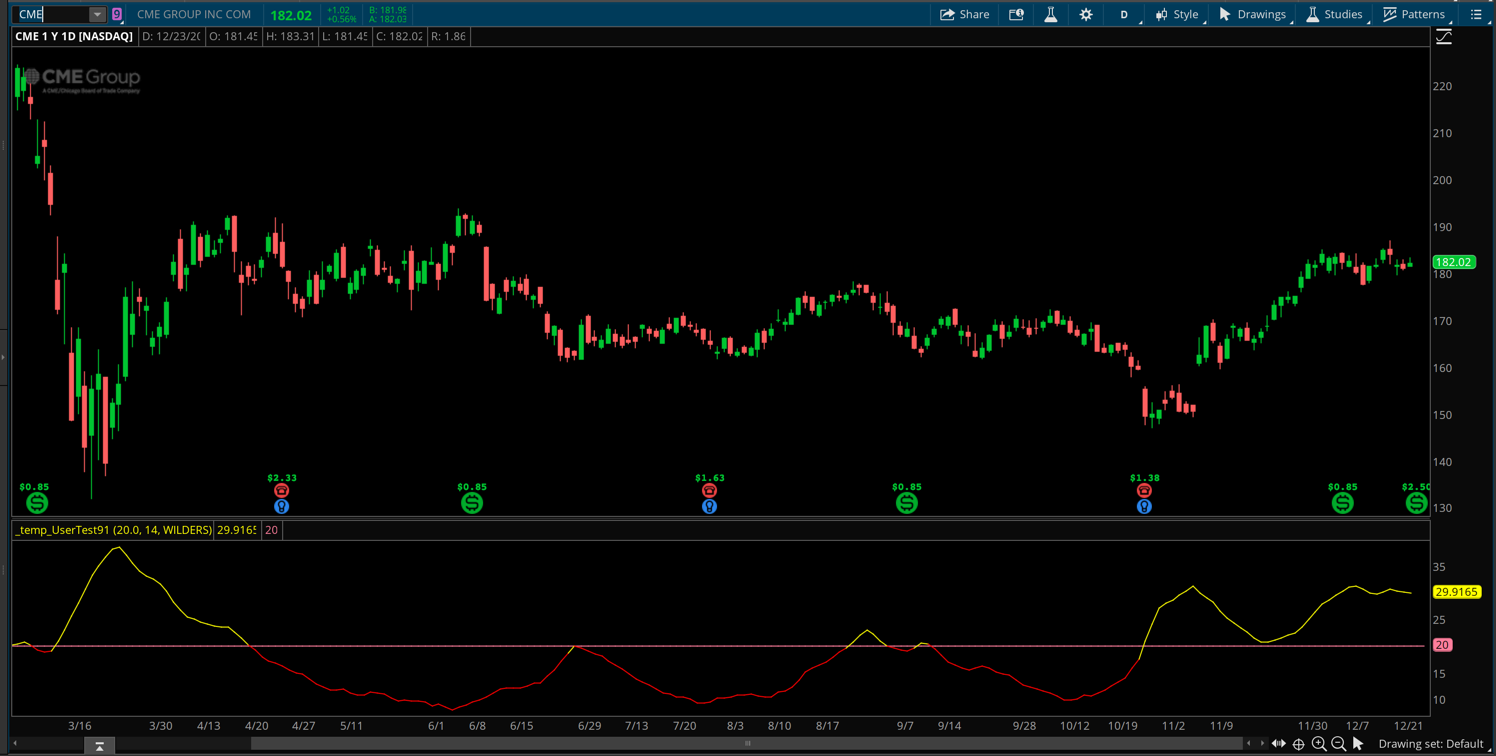
Settings would be Wilders

ADXLength – 14

TriggerLevel – 20

UsePlotColoring – True

AboveTrigColor – Yellow

BelowTrigColor – Red

EqualTrigColor – Cyan

ColorCellBGOnAlert – true

See pic shows line colors as it traverses the 20 line.

Attachments:
Marked as spam
Posted by (Questions: 1, Answers: 0)
Asked on December 22, 2020 4:06 pm
157 views
0
Private answer

I copied the code directly from the built-in chart study on Thinkorswim named "ADX".

I added a user input for the limit, another line of code to plot that limit level on the chart. And a third line of code to dynamically set the color of the ADX based on it's position above or below that limit.

declare lower;
input limit = 20.0;
input length = 14;
input averageType = AverageType.WILDERS;
plot adx = DMI(length, averageType).ADX;
plot limitLine = limit;
adx.AssignValueColor(if adx > limit then Color.YELLOW else Color.RED);

Screenshot below shows the result matches your example.

Attachments:
Marked as spam
Posted by (Questions: 37, Answers: 4087)
Answered on December 23, 2020 9:11 am