| ♥ 0 |
There is a study in TOS called Cumulative Overnight Volume. I noticed a post on this web site, and a response with some code, for putting this into a watchlist column. However, I am not finding a way to do a scan for the above average cumulative overnight volume. Perhaps it already in TOS and I’m just overlooking it. Can anyone help with this?
Marked as spam
Asked on December 21, 2020 3:22 pm
691 views
|
|
Private answer
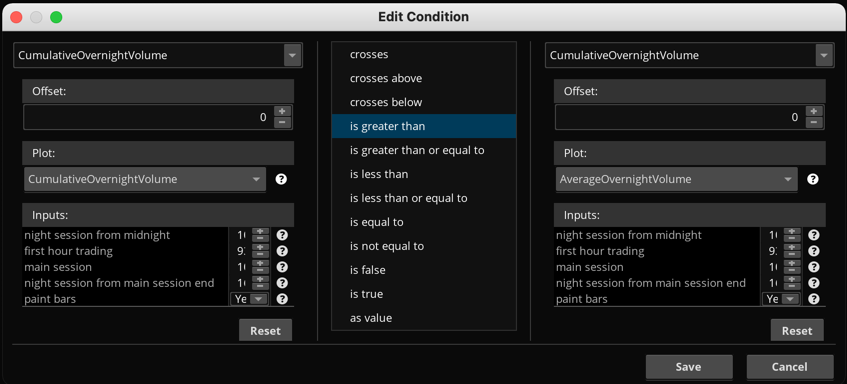
The chart study in question will only produce usable values during the premarket session. Once the regular session begins, there is no data produced that can provide any scan results. So this is strictly for use during premarket hours. The description of the study explains all of this. But I know folks don't like to read instructions so I made it a point to explain that here. The chart study is available in the list of studies when building a study filter using the Condition Wizard. So you can build this scan in just a few clicks of the mouse. You can learn how to use the Condition Wizard here: https://www.hahn-tech.com/thinkorswim-condition-wizard/ Screenshot below shows what this looks like. On the left side we select the plot named "CumulativeOvernightVolume". In the middle section you can select either "is greater than" or "crosses above". On the right side we select the plot named "AverageOvernightVolume". If you select "is greater than" for the middle section the scan results will show all stocks that have magenta colored volume bars. If you select "crosses above" the scan results will show only those stocks where the first magenta colored volume bar has appeared on the chart. Attachments:
Marked as spam
Answered on December 22, 2020 10:08 am
|