| ♥ 0 |
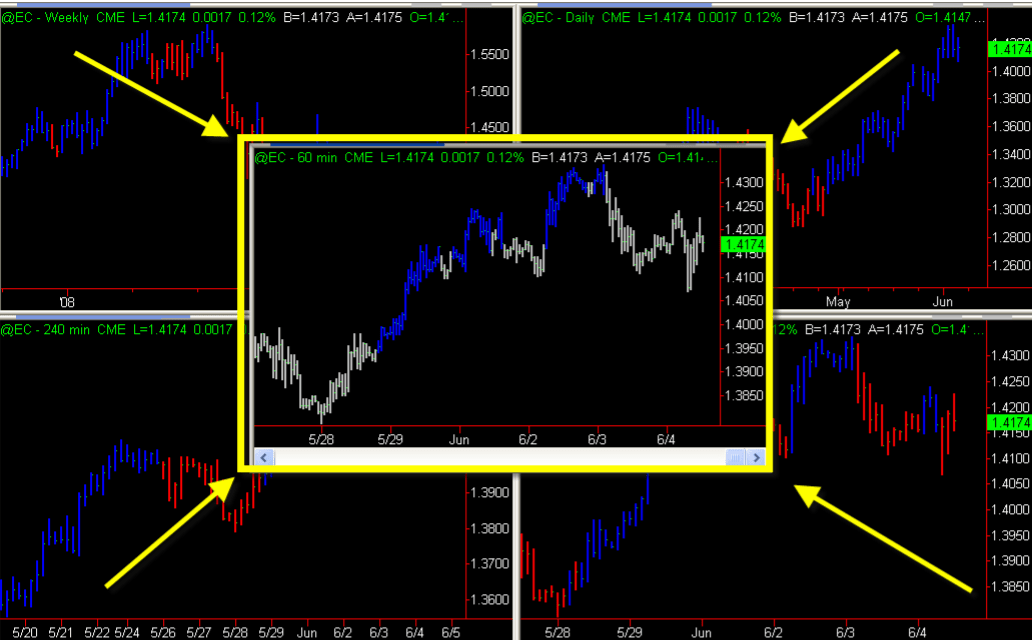
I have recently seen something with that title as I was going through John F Carter’s material, and figured someone had already done it for ToS, but I’ve found nothing similar on the internet. The idea is that you take multiple time frames, and when their respective TTM Trend colors coincide, they are shown on the (1D) chart, otherwise the candlesticks remain grey. Can someone help by providing the code? *sorry for deleting the original question. Attachments:
Marked as spam
Asked on September 1, 2019 4:38 pm
396 views
|