hi pete. so glad you feel much better now!
i have this indicator(code below) called the accountant written by kumobob.
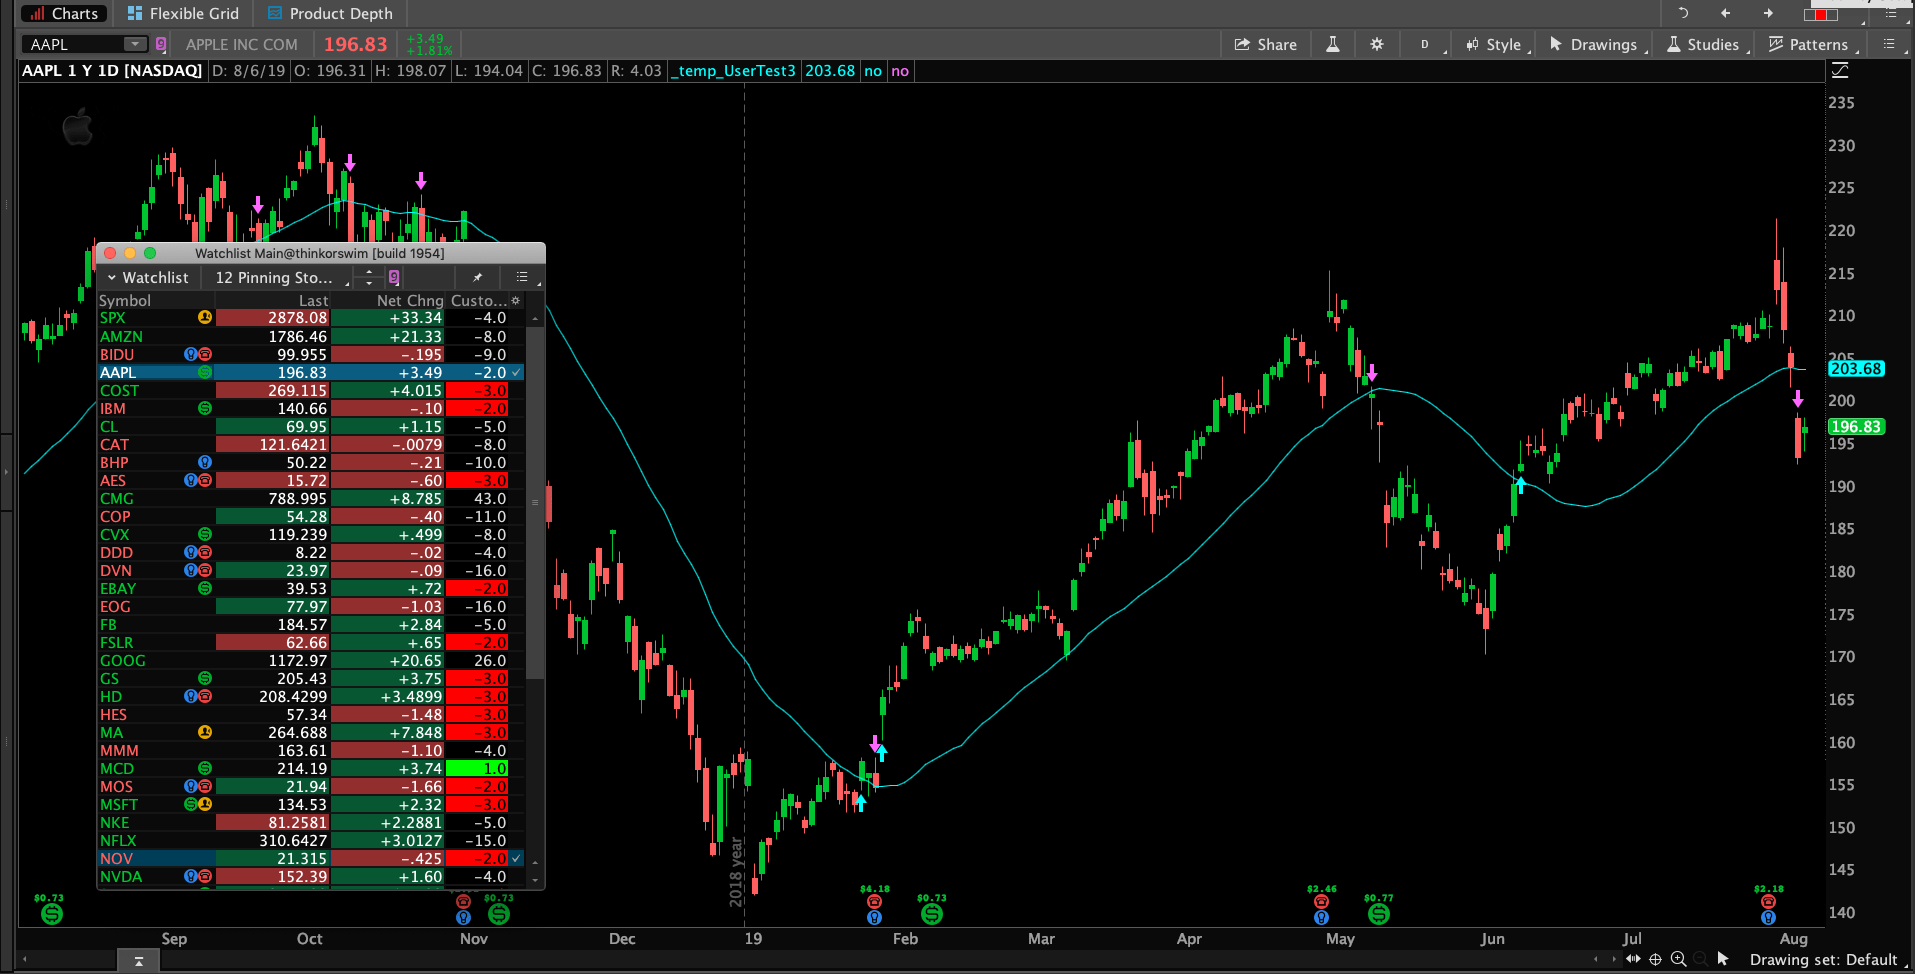
im trying to get the watchlist to turn red when the indicator hits a “sellpoint” and green if the indicator hits a “buypoint”. the very last line of the code (assignbackground) is my attempt on figuring it out but it only seems to work for the green but never works for the red. i would love your help with this!
Ru
code:
def LastBar = IsNaN(close);
input DemoLength = 30;
def Price_Data = if LastBar then Double.NaN else close;
def price = if LastBar then 0 else close;
def MA_Data = if LastBar then Double.NaN else Average(close, DemoLength);
def ma = if LastBar then 0 else Average(close, DemoLength);
input PlotArrows = No;
def DnSignal = if LastBar then Double.NaN else
if PlotArrows and Crosses(( Price_Data > MA_Data) != 0, 0.5, no) then Price_Data else Double.NaN;
#DnSignal.SetPaintingStrategy(PaintingStrategy.ARROW_DOWN);
def UpSignal = if LastBar then Double.NaN else
if PlotArrows and Crosses(( Price_Data < MA_Data) != 0, 0.5, no) then Price_Data else Double.NaN;
#UpSignal.SetPaintingStrategy(PaintingStrategy.ARROW_UP);
# *** Describe the conditions for Buy and Sell to your indicator ***
def Buy = price > ma; # if Price is above MA then TRUE
def Sell = price < ma; # if Price is below MA then TRUE
input Accountant = Yes;
input Buy_SellPoints = Yes;
input CashPosition = No;
declare lower;
# Returns 1 if first trade is Buy and -1 if first trade is sell
# _____________________________________________________________
def Long = if Crosses(( price > ma) != 0, 0.5, yes) then -ma else 0;
def Short = if Crosses(( price < ma) != 0, 0.5, yes) then ma else 0;
def L = if Long < 0 then -1 else 0;
def S = if Short > 0 then 1 else 0;
rec TradeCount = compoundValue(1, -L + S + TradeCount[1], 0) ;
rec First_Trade = if compoundValue(1, First_Trade[1], 0) == 0 then
compoundValue(1, Long + Short, 0) else compoundValue(1, First_Trade[1], 0);
rec TTL2 = if TradeCount > 1 then compoundValue(1, Long + Short + TTL2[1], 0) else 0;
def Profit2 = if TradeCount <= 1 then 0 else if !Accountant then Double.NaN else TTL2;
def CurrentValue = if Buy then low() else if Sell then high() else 0;
def Balance = First_Trade + Profit2 + Profit2;
def Cash = if !Accountant or !CashPosition then Double.NaN else Balance;
#Cash.SetDefaultColor(Color.WHITE);
#Cash.SetPaintingStrategy(PaintingStrategy.LINE);
#Cash.SetLineWeight(1);
def Net = if LastBar then Double.NaN else if Sell then Balance – close else if Buy then Balance + close else 0;
#Net.AssignValueColor(if Buy then Color.GREEN else Color.RED);
# ____________ Buy and Sell Points __________
plot BuyPoint = if !Buy_SellPoints then Double.NaN else if Long then Net else Double.NaN;
BuyPoint.SetPaintingStrategy(PaintingStrategy.POINTS);
BuyPoint.SetLineWeight(1);
plot SellPoint = if !Buy_SellPoints then Double.NaN else if Short then Net else Double.NaN;
#SellPoint.SetPaintingStrategy(PaintingStrategy.POINTS);
#SellPoint.SetLineWeight(1);
# ____________ END Buy and Sell Points __________
AddLabel(Accountant, Concat( Net, Concat(” “, if Net > 0 then “Good Job!” else “Oh No!”)), if Net > 0 then Color.GREEN else Color.RED);
# Keep this comment or TOS will eat it
#AddChartLabel(Accountant, concat( Net, concat(” “, If Net > 0 then “Good Job!” else “Oh No!”)), if Net > 0 then Color.Green else Color.Red);
AssignBackgroundColor(if BuyPoint[1] then Color.dark_GREEN else if sellpoint then Color.dark_RED else color.black);