Two different MACD Histograms above or below zero


Category:
0
0

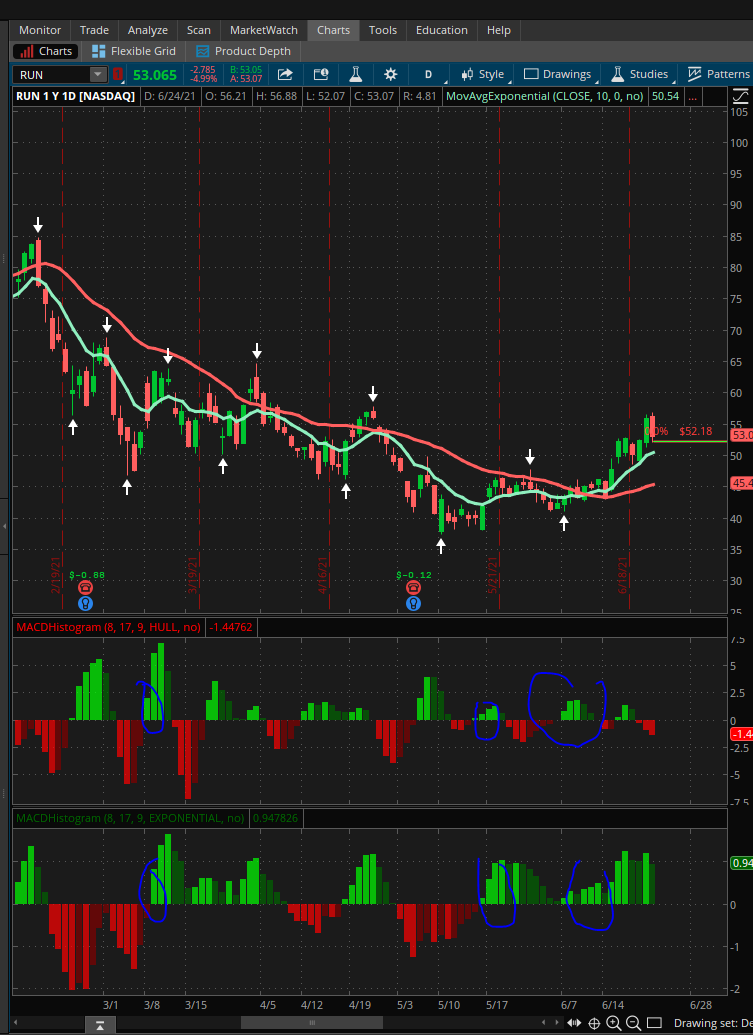
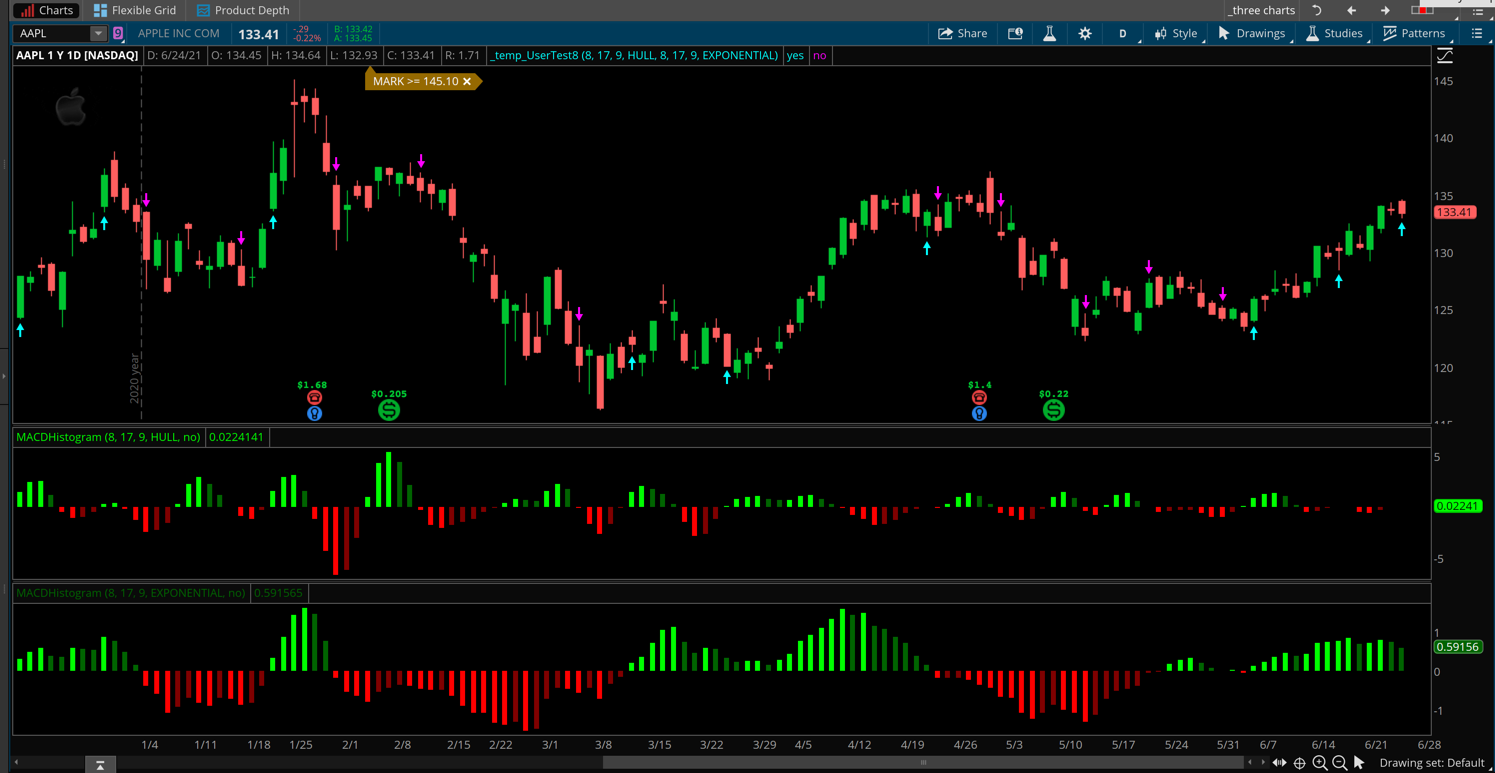
First of all, thank you for all you have been doing. I am reaching to you on whether could be a scan using TOS on MACD Histogram bars , where MACD EMA 10 is equal HullEMA 10. meaning where MACD (EMA 10 and HULLEMA 10 are green or red at this same time), with green background (the word “bullish”) and Red (the word ” bearish). Rationale, I discovered that where both MACD EMA and HULL EMA are both green or red, there is usually a big move. I will appreciate your feed back on this.

Attachments:
Marked as spam
Posted by (Questions: 1, Answers: 2)
Asked on June 24, 2021 2:22 pm
116 views
0
Thank you so much. I am currently having issues with the time frame and it is somehow difficult to set it at difference time frame.
( at June 24, 2021 7:45 pm)
0
Can the code be adjusted to first bar on the MACD, below or above the zero line at the same time?
( at June 24, 2021 8:05 pm)
0
The time frame is selected on the chart and not within the study. The code was written as you have originally requested. If you tried to modify the code to pick only those places where both histograms had their very first bar in each direction: 1. It would not match the example screenshot you provided AND 2. There would be only two signals showing on the screenshot example I provided with my answer. The is the best I can do for a free solution in the Q&A Forum.
( at June 24, 2021 8:23 pm)
0
Private answer

I updated your question title so that is makes sense to other users and is easier to locate in when searching for this type of solution. Your previous title included details that were unnecessary and omitted details that were most helpful.

Here is the solution you requested. I have included user inputs so that other visitors of this post will be able to adjust the settings to fit their own preferences.

input fastLengthOne = 8;
input slowLengthOne = 17;
input MACDLengthOne = 9;
input averageTypeOne = AverageType.HULL;
input fastLengthTwo= 8;
input slowLengthTwo= 17;
input MACDLengthTwo= 9;
input averageTypeTwo= AverageType.EXPONENTIAL;
def diffOne = MACD(fastLengthOne, slowLengthOne, MACDLengthOne, averageTypeOne).Diff;
def diffTwo = MACD(fastLengthTwo, slowLengthTwo, MACDLengthTwo, averageTypeTwo).Diff;
def bothAboveZero = diffOne > 0 and diffTwo > 0;
def bothBelowZero = diffOne < 0 and diffTwo < 0;
plot bothAbove = bothAboveZero and !bothAboveZero[1];
bothAbove.SetPaintingStrategy(PaintingStrategy.BOOLEAN_ARROW_UP);
bothAbove.SetDefaultColor(Color.CYAN);
plot bothBelow = bothBelowZero and !bothBelowZero[1];
bothBelow.SetPaintingStrategy(PaintingStrategy.BOOLEAN_ARROW_DOWN);
bothBelow.SetDefaultColor(Color.MAGENTA);

Screenshot below shows how this appears on a daily chart of AAPL.

Attachments:
Marked as spam
Posted by (Questions: 37, Answers: 4087)
Answered on June 24, 2021 3:13 pm
0
Thank you for your quick response. I will go through this over the weekend and get back to you on whether it can be modified to suit the purpose for a paid service. My original intention was where both indicators are both green or red at the first bar, where there is momentum. I think this can be matched with RSI above or below zero. I want to be able to set the time frame within the study. I will get back to you.
( at June 25, 2021 5:51 am)