Variable getting Reset


Category:
0
0

I tried to display a bubble at the mid point of a plot. Tried in two ways. (1) One show at the mid point of the chart excluding expansion area on the right. (1) Second at Mid point of the chart including expansion area. First one does not work. But Second one works. My code is as follows (with comments next to the code)

declare lower;

Plot Line1=1;
plot Line = 0;

def lastBar = if IsNaN(close())then double.Nan else barNumber() ; #(last bar was at 61)

def TotBars = HighestAll(BarNumber());     #(including 10 bar expansion, total bars=71)

AddLabel( yes, Concat(lastBar, TotBars), Color.RED );  * shows correctly 61 and 71

AddChartBubble( barNumber() ==lastBar/ 2 or barNumber() == ((lastBar / 2) + .5), 1,

concat(barnumber(), lastBar ) , Color.YELLOW, yes);           #prints at bar#1 and shows LastBar=1

AddChartBubble( barNumber() == TotBars / 2 or barNumber() == ((TotBars / 2) + .5), 0,

Concat(barnumber(), totBars) , Color.YELLOW, yes);  #prints correctly at bar  36 shows totBars=71

I feel I do not understand how Thinkscript variables work (or made some stupid error!~). I am confused why the value of totbars remained unchanged at 71 while Lastbar was changed to 1 and did not remain at 61.

Also note that  lastBar was not set to 2, 3 at each bar but stopped at 1.

Thanks

Attachments:
Marked as spam
Posted by (Questions: 11, Answers: 16)
Asked on April 1, 2018 8:32 pm
463 views
0
Private answer

Your screenshot is deficient. I cannot see the rest of the chart. Which means I cannot see if there is any right-expansion area. But more importantly, I cannot see the ticker symbol or the time frame used. Which means I cannot replicate the chart on my system.

If one plots correctly and the other does not, why not just use the logic from the one that plots correctly for all of them? You say you want to plot chart bubbles in the mid point of a plot. Your comments indicate you have one that does that, and that you know which one that is :

AddChartBubble( barNumber() == TotBars / 2 or barNumber() == ((TotBars / 2) + .5), 0, Concat(barnumber(), totBars) , Color.YELLOW, yes);

The part of that code that determines the horizontal position of the chart bubble is this:

barNumber() == TotBars / 2 or barNumber() == ((TotBars / 2) + .5)

So use that for all of them. Problem solved. Although I am a bit concerned that you have an OR in that statement. Unless you are trying to plot the chart bubble along two different points of the horizontal axis, that OR should not be there. Which means the section on either side of the OR is likely producing the same exact result.

Marked as spam
Posted by (Questions: 37, Answers: 4087)
Answered on April 2, 2018 7:24 am
0

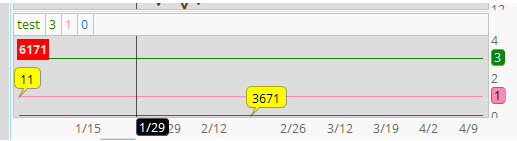
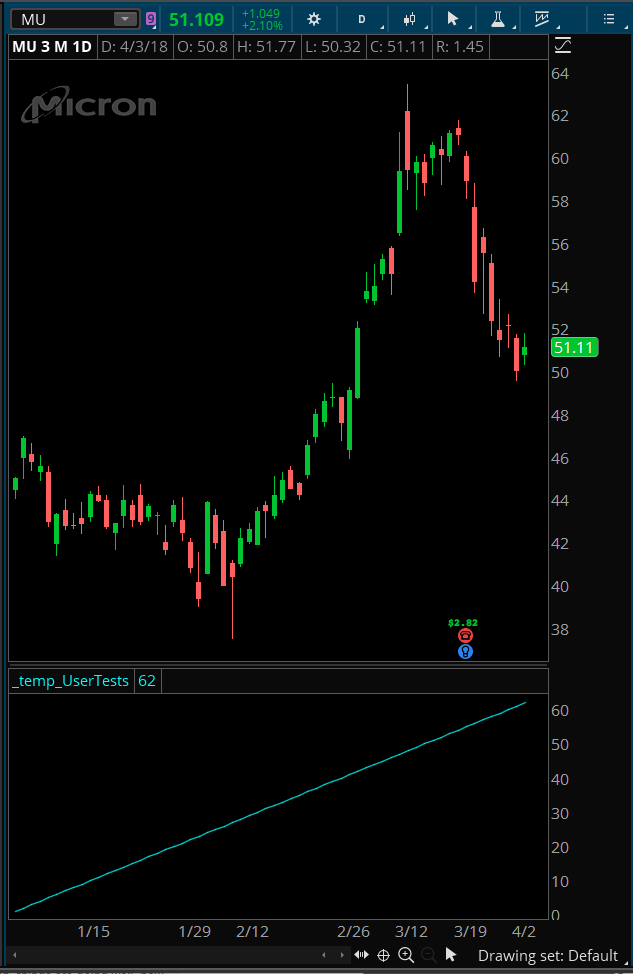
The code I posted produced same issue on any chart of any period. Could not post another screenshot in this comments section but the one I posted was for stock symbol MU, a 3 Month daily chart as of 4/1/2018 with 61 closed bars and a 10 bar right expansion area. I tried to show the bubble at the point corresponding to bar 31 (the middle of closed bars). That did not work. It displayed at Bar #1. Still learning programming and wanted to see if you could help resolve my confusion as to why a variable (Last Bar which was 61 in Add Label is getting reset later. I tried the other variable including expansion area just to see a what-happens-if-I-did-that. I really can work without displaying any bubble at all on the chart.. this exercise is just is to learn thinkscript from my mistakes.

BTW The OR statement is to get the “mid” point of total bars depending on whether the total bars are even or odd. Putting parentheses around the statement with the OR condition did not change the result

( at April 2, 2018 8:34 pm)
0
Private answer

Attached screenshot is your code, adjusted to troubleshoot the issue. To troubleshoot the issue and demonstrate the answer to your question I merely turned off all plots and converted your lastBar variable into a plot.

declare lower;
def Line1=1;
def Line = 0;
plot lastBar = if IsNaN(close())then double.Nan else barNumber() ; #(last bar was at 61)
def TotBars = HighestAll(BarNumber()); #(including 10 bar expansion, total bars=71)
#AddLabel( yes, Concat(lastBar, TotBars), Color.RED ); # shows correctly 61 and 71
#AddChartBubble( barNumber() ==lastBar/ 2 or barNumber() == ((lastBar / 2) + .5), 1, concat(barnumber(), lastBar ) , Color.YELLOW, yes); #prints at bar#1 and shows LastBar=1
#AddChartBubble( barNumber() == TotBars / 2 or barNumber() == ((TotBars / 2) + .5), 0, Concat(barnumber(), totBars) , Color.YELLOW, yes); #prints correctly at bar 36 shows totBars=71

In the screenshot, you can see the value of the lastBar variable is incremental. It increments by one for each bar on the chart. Right expansion area is excluded. BarNumber() begins at the left and increments for each bar until the last bar on the chart.

Your statement for this variable: def lastBar = if IsNaN(close())then double.Nan else barNumber();

Is exactly the same as this: def lastBar = barNumber();

The value of the level One chart bubble will change depending on where you place it on the horizontal axis.

You are likely to have more questions but what I want you to take from this is the method I used to troubleshoot the issue. Whenever you get unexpected results, break everything down into the smallest functional piece and plot the values on the chart. Until you can visualize all the individual pieces you don’t have any hope of understanding what is going on. Software developers use a debug log. We must use plots on a chart.

What happens when you plot: barNumber() ==lastBar/ 2

What happens when you plot: barNumber() == ((lastBar / 2) + .5)

Question everything until your assumptions are replaced with empirical knowledge. That’s when everything becomes clear.

Attachments:
Marked as spam
Posted by (Questions: 37, Answers: 4087)
Answered on April 3, 2018 8:19 am
0

Yes. This Plot technique is ia fantastic idea that I learnt from you now..OK..I see my real problem as well. I intuitively (and now I see, correctly) thought that Think Script may assign the variable for each bar but then I immediately, without thinking through and noting that barNumber() ==lastBar/ 2 or lastBar/ 2 +.5 can only be true for 1, I somehow felt that if it evaluates for each bar then it should print a bubble for each bar. Stupid error, but in the process I learnt a great technique, Pete. Thank you.

( at April 3, 2018 9:42 am)
0

Love to hear that. Awesome! Congrats and have fun!

( at April 3, 2018 12:24 pm)