| ♥ 0 |
Hi Pete,
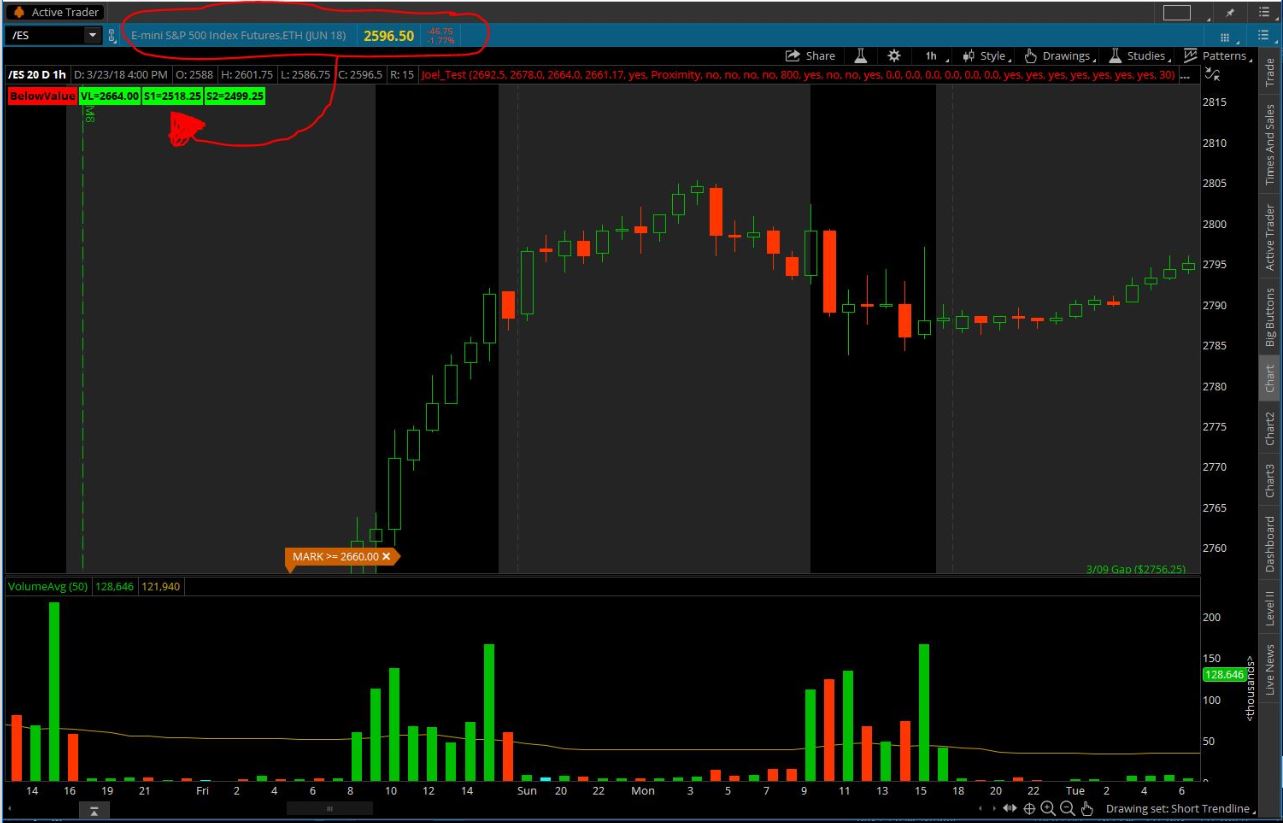
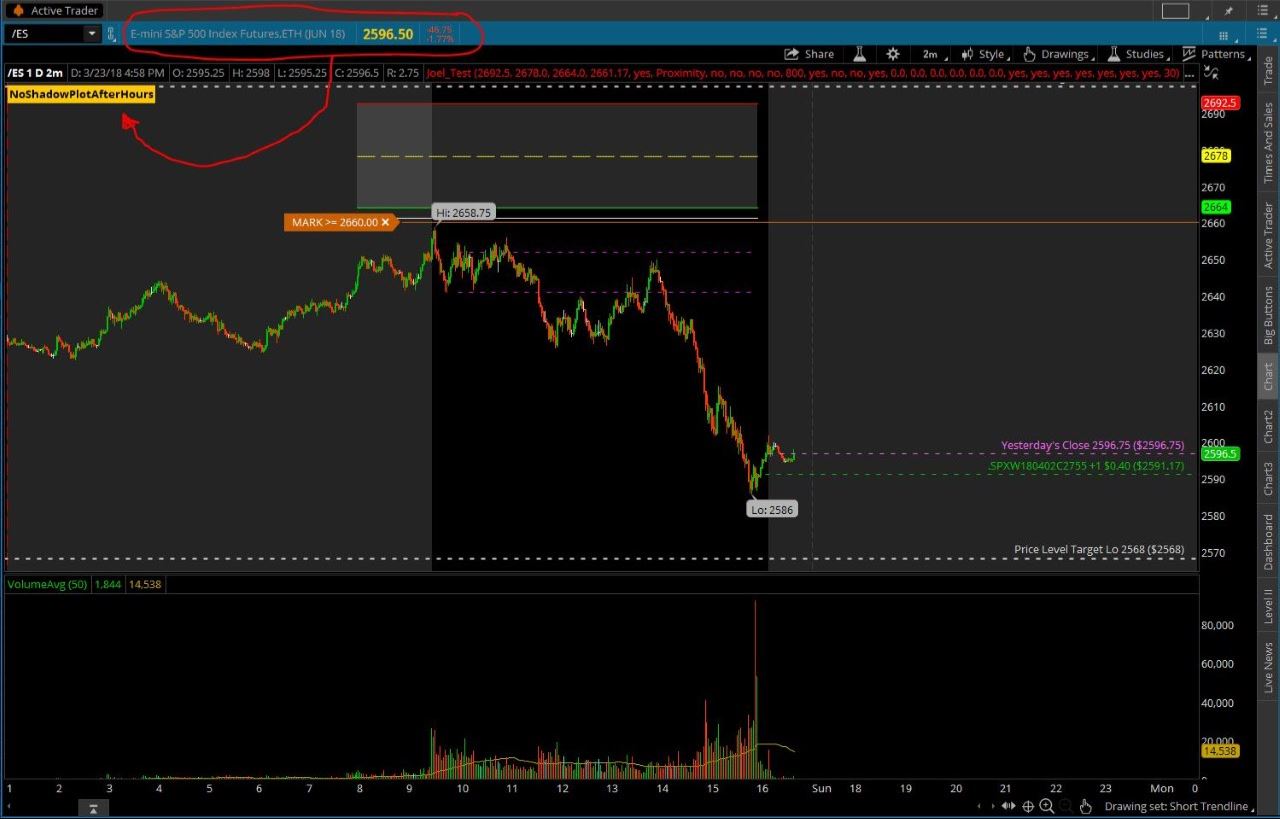
It’s hard for me to see the change of price & percentage on the TOS for any selected symbol (see attach Pic). I’ve been searching to see if I could find a similar think-script that I could learn from and try to create a label in the top left corner of my chart that would display the following (see list below), and also have the background labels change colors to Green (+change) & Red (-change). I haven’t found anything thus far and I’m at the point of seeking your expertise. Pic is a snapshot of something I saw in a YouTube video that I’ve been trying to modify, to accomplish my goal.
Attachments:
Marked as spam
Asked on March 25, 2018 5:51 am
5778 views
|
|
Private answer
Well since you mentioned that you are looking to ‘learn’. How about we start by providing some resources. Not sure if you used the search box on the site before posting your question. Basic Chart Label with User Input for Display Value:One of our very first videos was on this topic: https://www.hahn-tech.com/thinkorswim-display-name-saved-chart/ Display the Current Day’s High and Low:We also have used chart labels in various other videos along the way. This one displays daily high and low: https://www.hahn-tech.com/thinkorswim-alert-high-low-version-two/ Change Label Color Based on Lower StudyHere is a post from this Q&A forum. Shows the technique of changing the color of the label as the value of Relative Volatility Index changes: https://www.hahn-tech.com/ans/add-chart-label-for-relative-volatility-index/ Display Data from Another SymbolThis one shows how to change the chart label based on the direction of price for a symbol not plotted on the chart: https://www.hahn-tech.com/ans/label-color-change-as-current-price-fluctuates/ SummarySo yeah, after accumulating all these examples I am sure you didn’t search before posting the question. Which is actually a good thing. Because it gave me the opportunity to consolidate all these resources into a single post. A gold mine for those seeking to learn how to add chart labels to their thinkscript repertoire. Unless you needed help with the math to compute your label’s values. These links should provide what you need to get things rolling. Marked as spam
Answered on March 25, 2018 8:55 am
|