| ♥ 0 |
Hi Pete ; Wondering if you would create ToS lower study of Vix3M/Vix. Pine script code is below and link to the code. Thanks! / © bauhaus28 //@version=4
https://www.tradingview.com/script/LEHBPgNC-VIX3M-1M-ratio/
Marked as spam
|
|
Private answer
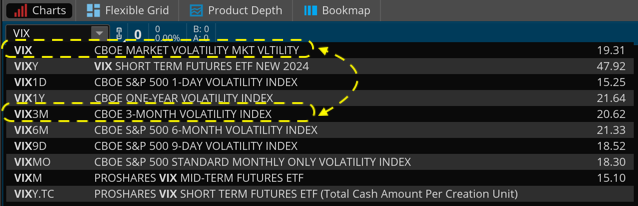
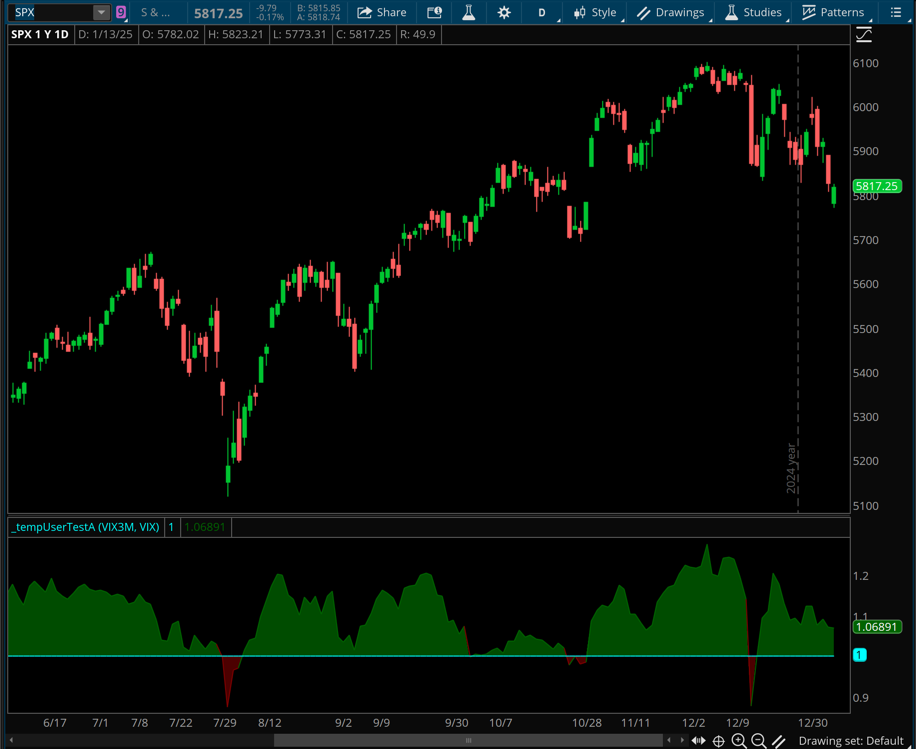
Here is the chart study, which includes 2 user inputs so you can adjust the ticker symbols for each element of the ratio. Which means you can use this for a much wider range of solutions than just the VIX. Two screenshots are included below. The first one shows the current list of ticker symbols available for VIX. The two ticker symbols used as default values for this study are marked. The second screenshot shows what this looks like on a current daily chart of SPX.
Attachments:
Marked as spam
Answered on January 13, 2025 12:31 pm
|