VWAP reference different than vwap() function


Category:
0
0

Long Version:

I want to make a scan study where VWAP weekly is greater than VWAP monthly. I can easily do that using the conditional wizard in the Scan tab which creates the following:

plot scan = reference VWAP("time frame" = "WEEK")."VWAP" is greater than reference VWAP("time frame" = "MONTH")."VWAP";

I’m not confident; however, because plotting this against a chart gives different results:

def VWAPw = vwap(period = AggregationPeriod.WEEK);
def VWAPm = vwap(period = AggregationPeriod.MONTH);
plot scan = VWAPw > VWAPm;

Image attached – daily time frame chart.

Notes:

  • I suspect I will have to dive into the TOS VWAP function code (which seems to do some gyrations during the first week of the month)
  • I think I can get around the multi-time scan limitation by using the methods you have described.

I searched the forum and didn’t find this example. I can hack out some thinkscript, I just need to be steered in the right direction (I’m not a VWAP expert).

Thanks in Advance,
Bill

Attachments:
Marked as spam
Posted by (Questions: 1, Answers: 1)
Asked on July 7, 2023 6:13 am
55 views
0
Private answer

VWAP reference different than vwap() function

Yes, that is a correct statement. The VWAP chart study is a solution which resets the value of the vwap() function at the start of each period. Stated another way, the VWAP chart study is derived from the vwap() function.

I think the confusion lies in name which has been chosen to select the "period" or "time span" of the VWAP chart study. It does create quite a lot of confusion because they use the name "time frame" for the input parameter which selects the "span of time" used to determine the "periods". At the start of each new "period", the VWAP study resets the value of the vwap() function to the first bar of the new period. For each bar that follows the reset bar, the chart study computes a value using a very complex formula. And within that formula, the actual vwap() function is merely one small component.

So yes, the two sections of code you present in your question basically a comparison of apples and oranges. The two sets of data are completely different. I prepared two screenshots which demonstrated this on the chart. When you see these two data sets plotted on the chart it will help you to understand the massive differences between them.

How does that help you achieve your goal? Well I did not find sufficient details in your question to understand what your goal is.

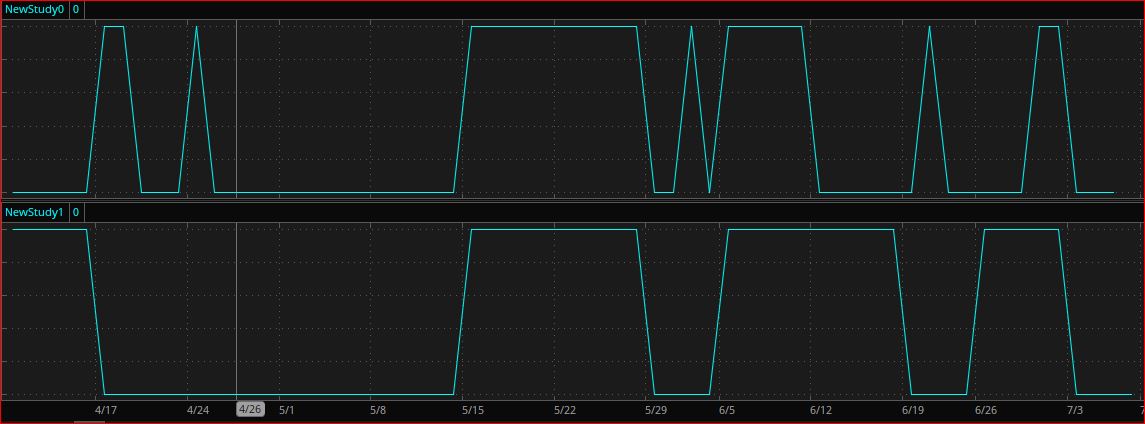
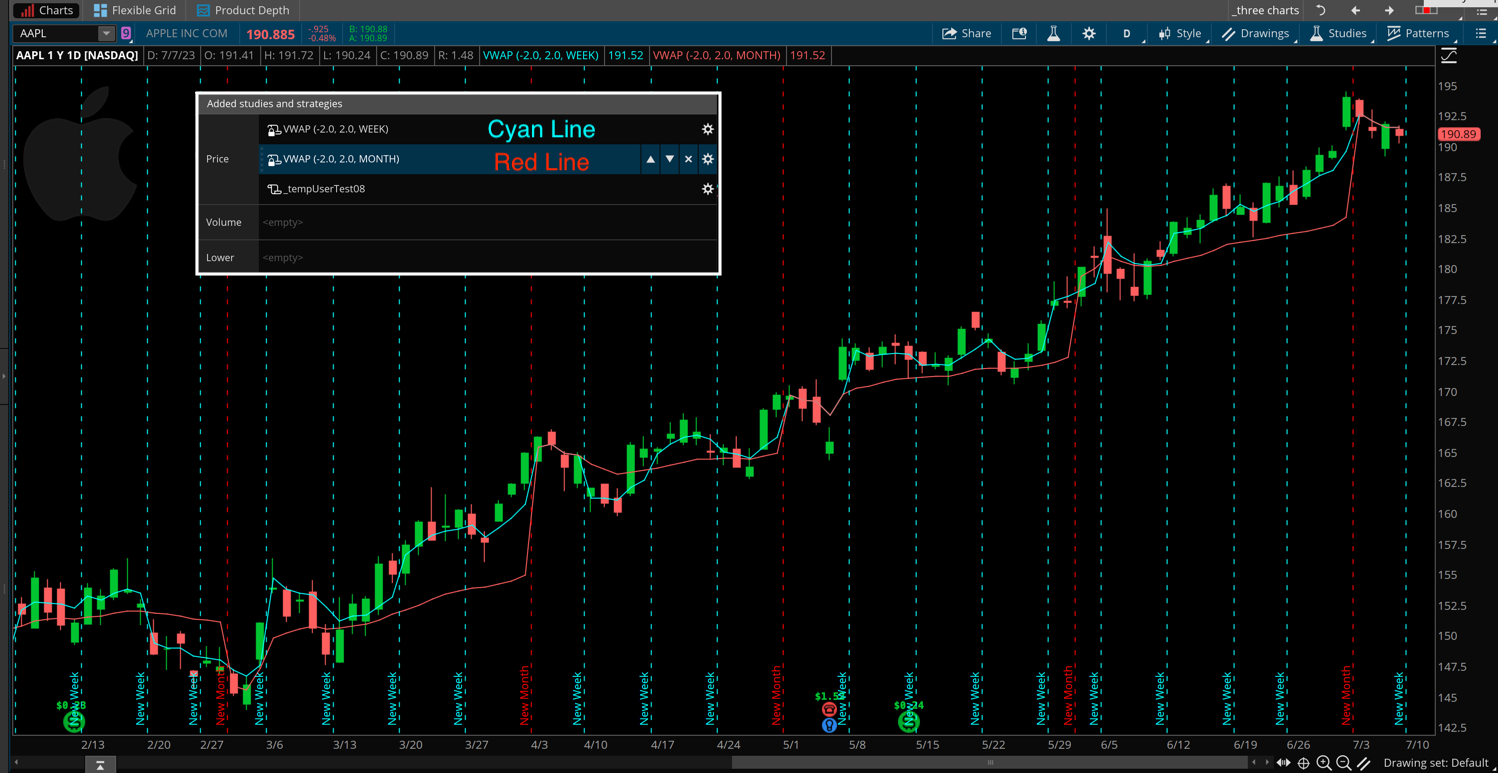
Reference the first screenshot below: If your goal is the build a scan based on comparing two different "time spans" of the VWAP chart study, then you will find your first section of code is 100% accurate.

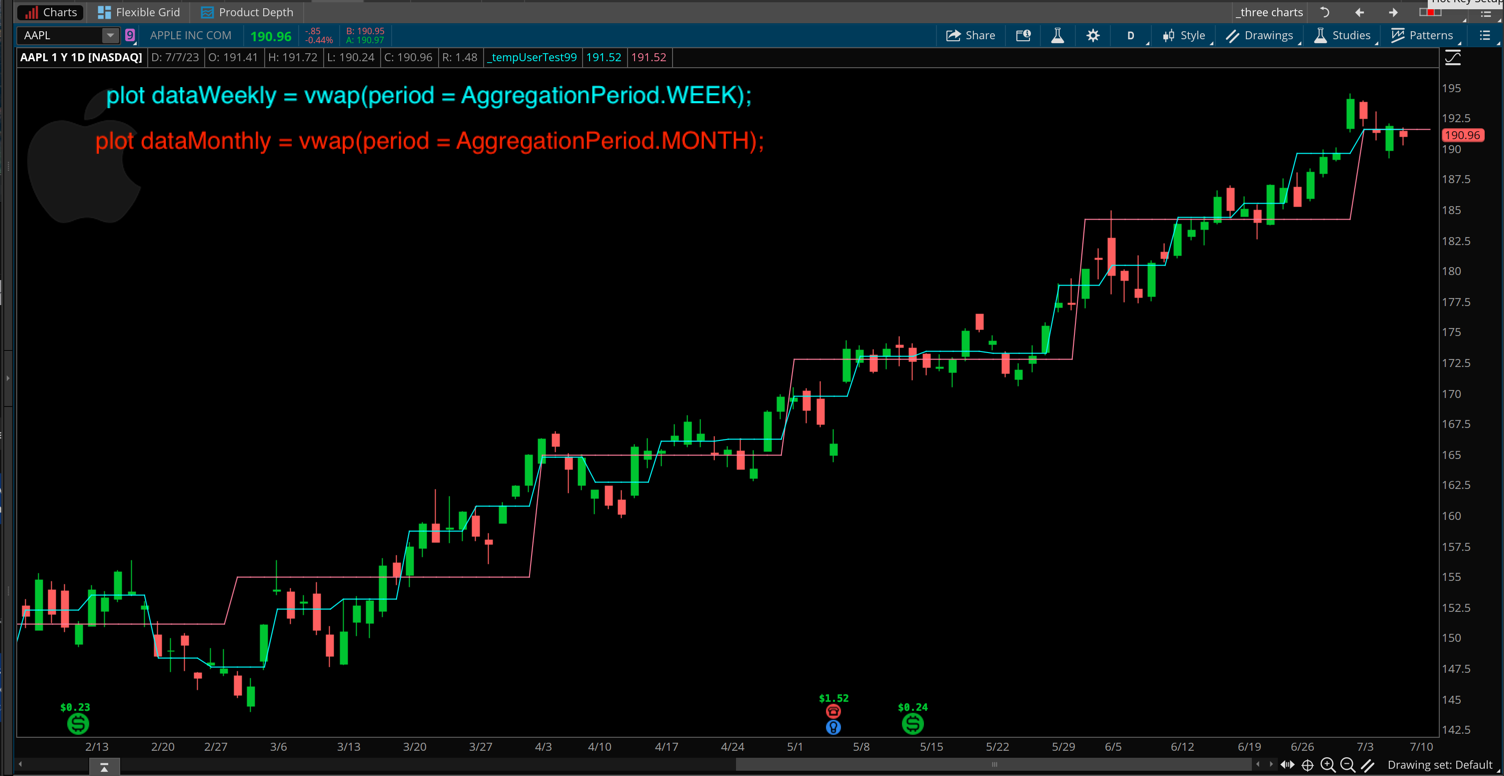
Reference the second screenshot below: If your goal is to compare the values of the vwap() function from two different "Aggregation Periods". Well you don't have any solution to do this on Thinkorswim. It's simply not supported.


Attachments:
Marked as spam
Posted by (Questions: 37, Answers: 4087)
Answered on July 7, 2023 8:38 am
0
Thanks a lot, Pete, you're the best! I really appreciate it. Regarding which one I want - that's fuzzy also. The trade "checklist" lists Weekly > Monthly as a criteria (hence the simple scan I created); however, the :"VWAP" label they use is based on the vwap function. It's also not clear whether it's a "must-have" or a "nice-to-have" which is common when you watch a lot of videos in a paid strategy. The "live trading" sessions often contradict the simple checklists. Since the scan is my own, I think I'll leave VWAP out and look at the label (there aren't that many results). Thanks again!
( at July 7, 2023 4:16 pm)
0
Sounds like a good plan. After posting my solution I considered a couple of other options to make it easier to spot these conditions (using vwap() function and higher aggregation periods). The first option involves adding two columns to a watchlist, one for the weekly and another for the daily. Then you can make a quick comparison on the watchlist. The second option involves taking the first option and exporting that to Excel using the RTD() function. Once you get that spreadsheet setup you can then do some quick formulas and maybe add conditional formatting to highlight cells red or green.
( at July 7, 2023 4:21 pm)
0
Thanks again, Pete. Solution 1 would be perfect because I could stay within TOS. You're hand-down the best, Mr. Hahn. No one provides the information and service that you do!
( at July 8, 2023 3:48 am)