Hey, nice work. I see you really understood my explanation and you did a really great job of trying to apply it. There are just a couple items to clean up. We only need the “isPeriodRolled” to evaluate true at the first intraday bar of the regular session. Your code skips that bar. We can fix that very simply. We only need a true/false variable that is true on the first bar of the regular session.
So we take your original:
periodIndx = if SecondsFromTime(Begin) > 0 and SecondsTillTime(End) >= 0 then 1 else 0;
And change it to this:
periodIndx = SecondsFromTime(Begin) == 0;
(we don’t need to do that if-then-else thing. It’s either true or false. And in Thinkscript, true equals 1 and false equals zero)
So you see that I changed the ‘> 0’ part of your statement to an ‘== 0’. When you had it set as ‘> 0’ it was causing the code to skip the first bar of the regular session hours.
This does cause the VWAP to reset on the first bar of regular session hours. Congratulations. You nearly had it. I’m proud of you.
But let’s clean this up a bit more. We can set the plot of this customized VWAP to hide the line during extended hours session:
plot VWAP = if SecondsFromTime(Begin) >= 0 and SecondsTillTime(End) > 0 then price else Double.NaN;
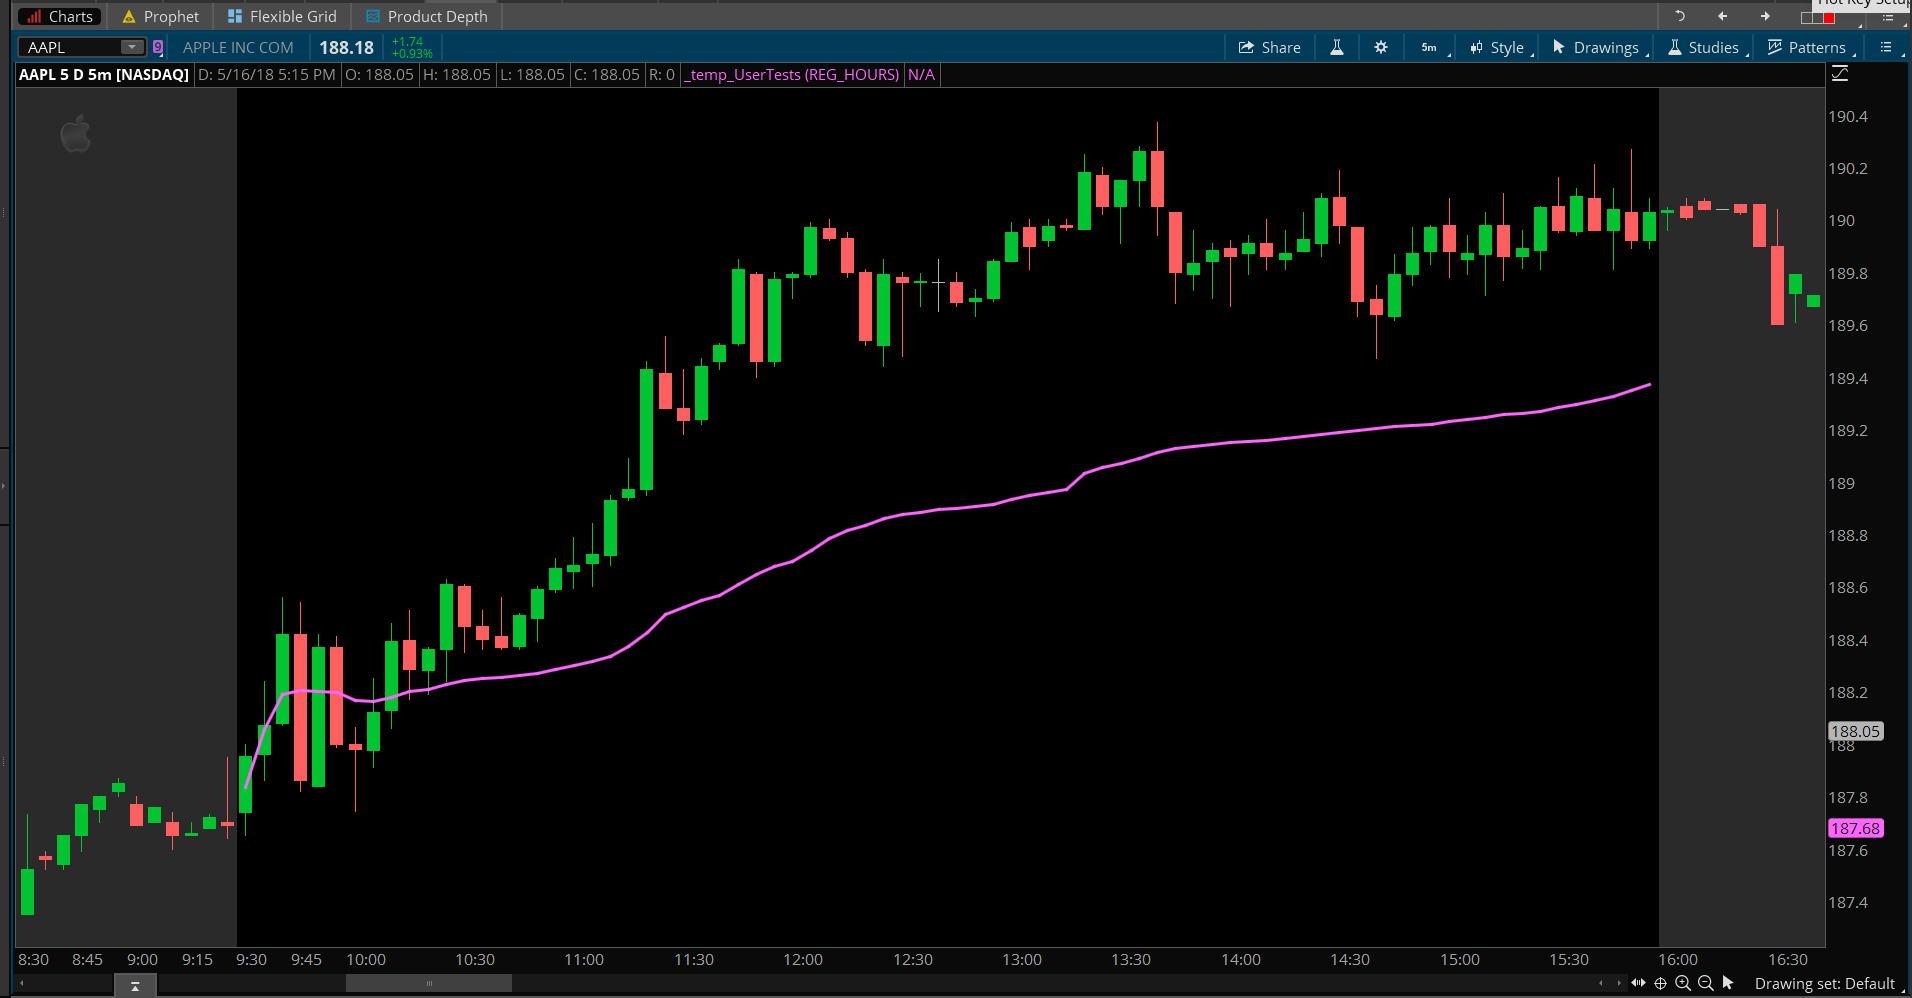
Should be done, right? Screenshot below shows the result.
I can tell you that your sample code ends up plotting a true/false value. The actual vwap value is not included anywhere in your code.
So did you look at the VWAP study that comes with Thinkorswim? Is that what you are using? There is a whole lot more going on than what you have included in your sample code. The study resets the value of the vwap plot based on a user input called “time frame”. When set to DAY, the study resets the vwap plot at the start of each day. To achieve your stated goal, you would need to add a new value to “time frame”. Call it “reg hours” or something. Then modify the switch/case statement for the timeFrame input to include a case for that selection.
Then to clean things up, you would need to further modify the plot statement so the vwap plot is set to Double.NaN during extended trading hours.
Thanks for your reply Pete. I’ve tried to rewrite the code based on what you’ve mentioned but I’m having trouble with modifying the plot statement so that it only shows the VWAP during REG_HOURS. How does everything else look?
input timeFrame = {default DAY, WEEK, MONTH, REG_HOURS};
def Begin = 0930;
def End = 1600;
def cap = getAggregationPeriod();
def errorInAggregation =
timeFrame == timeFrame.DAY and cap >= AggregationPeriod.WEEK or
timeFrame == timeFrame.WEEK and cap >= AggregationPeriod.MONTH;
assert(!errorInAggregation, “timeFrame should be not less than current chart aggregation period”);
def yyyyMmDd = getYyyyMmDd();
def periodIndx;
switch (timeFrame) {
case REG_HOURS:
periodIndx = if SecondsFromTime(Begin) > 0 and SecondsTillTime(End) >= 0 then 1 else 0;
case DAY:
periodIndx = yyyyMmDd;
case WEEK:
periodIndx = Floor((daysFromDate(first(yyyyMmDd)) + getDayOfWeek(first(yyyyMmDd))) / 7);
case MONTH:
periodIndx = roundDown(yyyyMmDd / 100, 0);
}
def isPeriodRolled = compoundValue(1, periodIndx != periodIndx[1], yes);
def volumeSum;
def volumeVwapSum;
def volumeVwap2Sum;
if (isPeriodRolled) {
volumeSum = volume;
volumeVwapSum = volume * vwap;
volumeVwap2Sum = volume * Sqr(vwap);
} else {
volumeSum = compoundValue(1, volumeSum[1] + volume, volume);
volumeVwapSum = compoundValue(1, volumeVwapSum[1] + volume * vwap, volume * vwap);
volumeVwap2Sum = compoundValue(1, volumeVwap2Sum[1] + volume * Sqr(vwap), volume * Sqr(vwap));
}
def price = volumeVwapSum / volumeSum;
plot VWAP = price;
VWAP.setDefaultColor(getColor(0));
Actually, I’m not so sure that is plotting correctly.