Watchlist column displaying bid ask spread


Category:
0
0

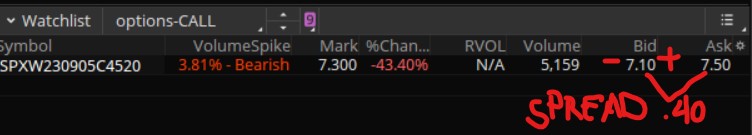
Hello Peter, I’ve tried to search this with no luck, wonder if it possible to create a custom column in the watchlist to show the current spread from a specific option, it would be the difference between the options price ASK – BID = spread : hope its understood, many thanks in advance for the help.

Attachments:
RESOLVED
Marked as spam
Posted by (Questions: 2, Answers: 1)
Asked on September 1, 2023 3:51 pm
70 views
0
Private answer

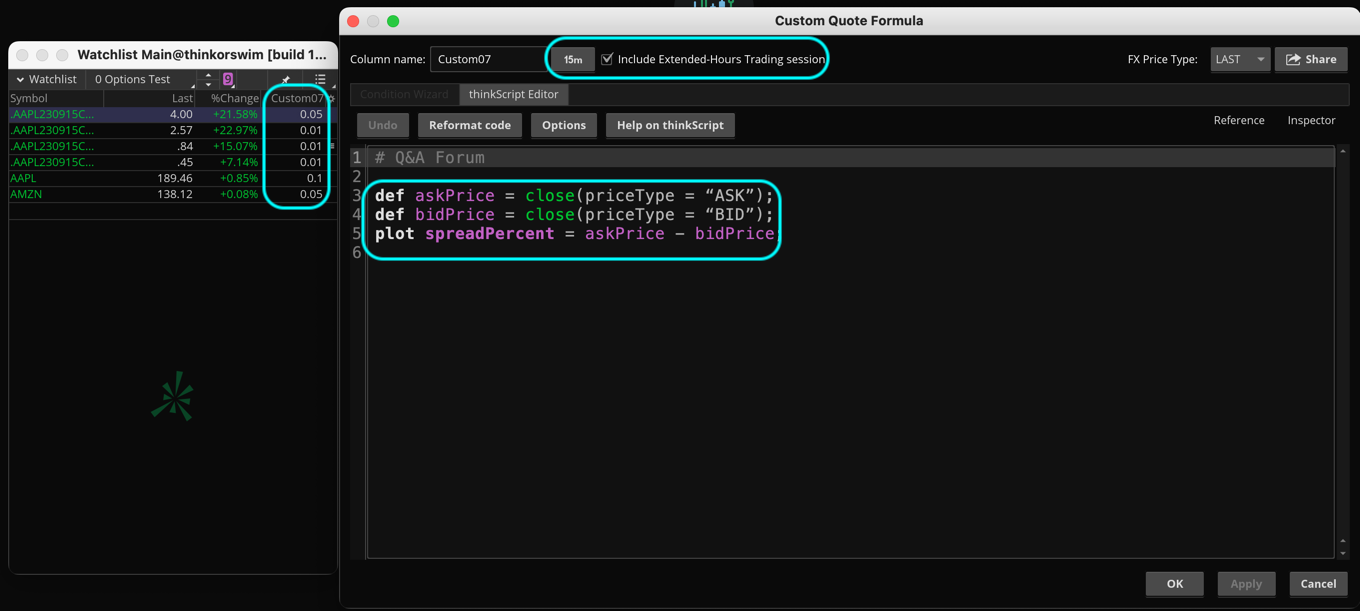
There is a previous solution which is very close. So I will include a link to that previous post because I created the solution to your request by modifying the solution to that previous post:

https://www.hahn-tech.com/ans/bid-ask-spread-column-in-options-chain/

In order to modify that solution to fit your request, I merely removed the line of code which read the price of the underlying stock. Then I updated the plot statement to compute the difference between the bid and ask. You can apply this solution to a custom watchlist column as well as a custom column in the options chain.

def askPrice = close(priceType = “ASK”);
def bidPrice = close(priceType = “BID”);
plot spreadPercent = askPrice - bidPrice;

This only works when the column is set to an intraday time frame, because this bid and ask prices are not available from a daily time frame or higher. Since we are in the after hours session at the time of this post, I have also set the column to include extended hours. (Why? Thinkorswim does not retain historical data for bid and ask, so we can only read the current bid and ask).


Attachments:
Marked as spam
Posted by (Questions: 37, Answers: 4087)
Answered on September 1, 2023 5:10 pm
0
Hi Pete, I've just tried the code but don't seem to show data, not sure if im doing something wrong or its because market is currently closed, did also tried w on demand, same result, showing "NaN"
( at September 2, 2023 8:40 am)
0
Did you apply the details I explained in the final paragraph of my solution? It seems to me that you ran into the very same thing that I did, which is why I included an explanation of how to adjust the time frame of the watchlist column to avoid displaying "NaN". If you have applied those settings as I described and still get "NaN", well then I would need to dig a bit deeper to find out what you are doing differently. Oh, and custom watchlist columns never work when OnDemad is activated. That is one of the known limitations of the OnDemand feature.
( at September 2, 2023 9:07 am)
0
when i try to add the code line "plot data = close(GetUnderlyingSymbol());" before the code you provided me, i cannot save.
( at September 2, 2023 9:31 am)
0
I'm not sure why you would even attempt to do that, as it was not part of the solution I provided to this question. That line of code you attempted to add to my solution was probably taken from the link I referenced in my answer. You cannot mix and match elements from multiple solutions unless you are very skilled at working with this scripting language. The solution? Use the code I provided in this solution, without any modifications.
( at September 2, 2023 9:40 am)
0
when i used the following i got the NaN: def askPrice = close(priceType = “ASK”); def bidPrice = close(priceType = “BID”); plot spreadPercent = askPrice - bidPrice;
( at September 2, 2023 10:12 am)
1
Sorry but I have already explained everything you need to do and I don't have anything more I can say. It works for me. And if you follow my instructions you should get the same results. So I have added a new screenshot to my solution. The screenshot shows the watchlist column displaying values, it shows the settings I told you to be sure to adjust. And it shows the code I have applied to the custom column. Please examine this screenshot and make sure you have followed all of my instructions.
( at September 2, 2023 10:26 am)
0
it worked now, i was using other time frame 1m and D, not sure why using the 15m tho , thanks a lot for your time!
( at September 2, 2023 10:29 am)