| ♥ 0 |
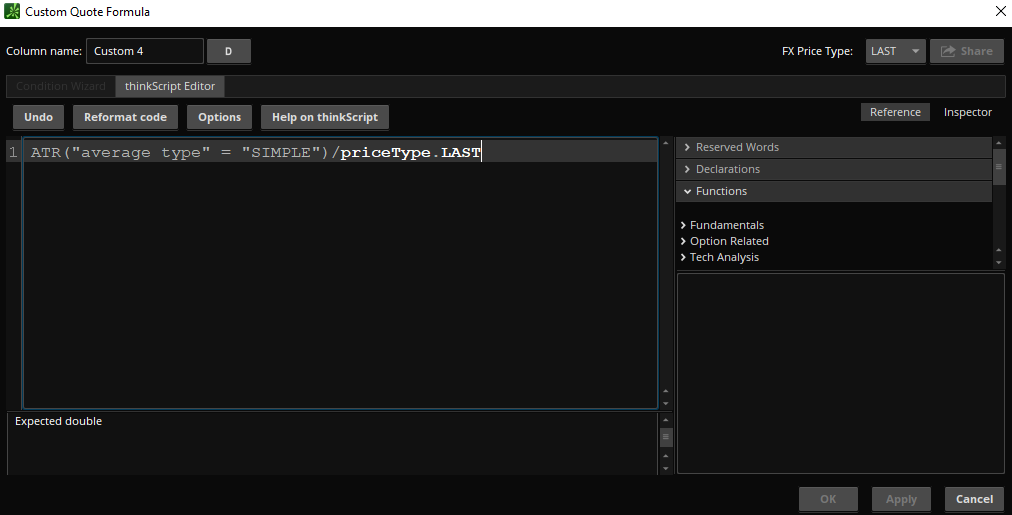
Hello Mr. Hahn! Hope you’re doing well. I am trying to create a custom column on my scans that shows the ATR(simple) over 14 bars divided by the average price over 14 bars for the respective ticker. Below is the code I came up with, however I cannot get the custom column to save whenever I put the division operator. I am assuming I am missing an operator or a line of code. I have also attached an image of the thinkscript editor screen. ATR(“average type” = “SIMPLE”)/priceType.LAST Would greatly appreciate it if you could help me out! This would give me an idea of how to create other custom columns in my scans. Again this is not a scan but one of the columns that will show up once the scan is completed. Thank you for your time. M. Arrafi Attachments:
Marked as spam
Asked on April 4, 2023 7:25 pm
113 views
|
|
Private answer
I see you are trying to learn so I will tailor my solution to help you learn as much as possible from this puzzle you are trying to solve. First up, the use of "PriceType.Last" is the problem in your attempt. Not the "division operator". How can I prove that? Try replacing "PriceType.Last" with "close" as follows:
There you go. Now lets clear up the confusion. I find it very common among those just learning thinkScript to mistakenly use "PriceType.Last" inappropriately. Whenever you want to reference the current actively traded price within a script you use the keyword "close". I am sure the "PriceType.Last" has its place but I almost never use it. Used in the way you attempted, it produces an error because this is actually a constant which must be used as a parameter of a function such as open, high, low or close. Full details on it's proper use is found here: https://toslc.thinkorswim.com/center/reference/thinkScript/Constants/PriceType/PriceType-LAST However I will repeat. I almost never use this. So just forget all about "PriceType.Last" entirely. Chances are you will never come across a scenario in which it is required. So back to the solution. The problem with the following line of script is that it does not meet your description of "ATR(simple) over 14 bars divided by the average price over 14 bars"
So how do we fix this? In keeping with your existing structure we can replace "close" with a reference to a built-in study named "SimpleMovingAvg". Then we set the length to 14, as shown below:
Note that I have also multiplied the computed value by 100 because custom watchlist columns only display 2 decimal points. So if you want to see the entire value you need to convert to a percent by multiplying it by 100. As a bonus, here is the full featured version that produces the same exact results. This version includes several inputs so you can adjust the various parameters as needed. The output values are exactly the same as the single line solution provided above. But this one is much easier to adjust to fit individual preferences:
Marked as spam
Answered on April 5, 2023 9:35 am
|