| ♥ 0 |
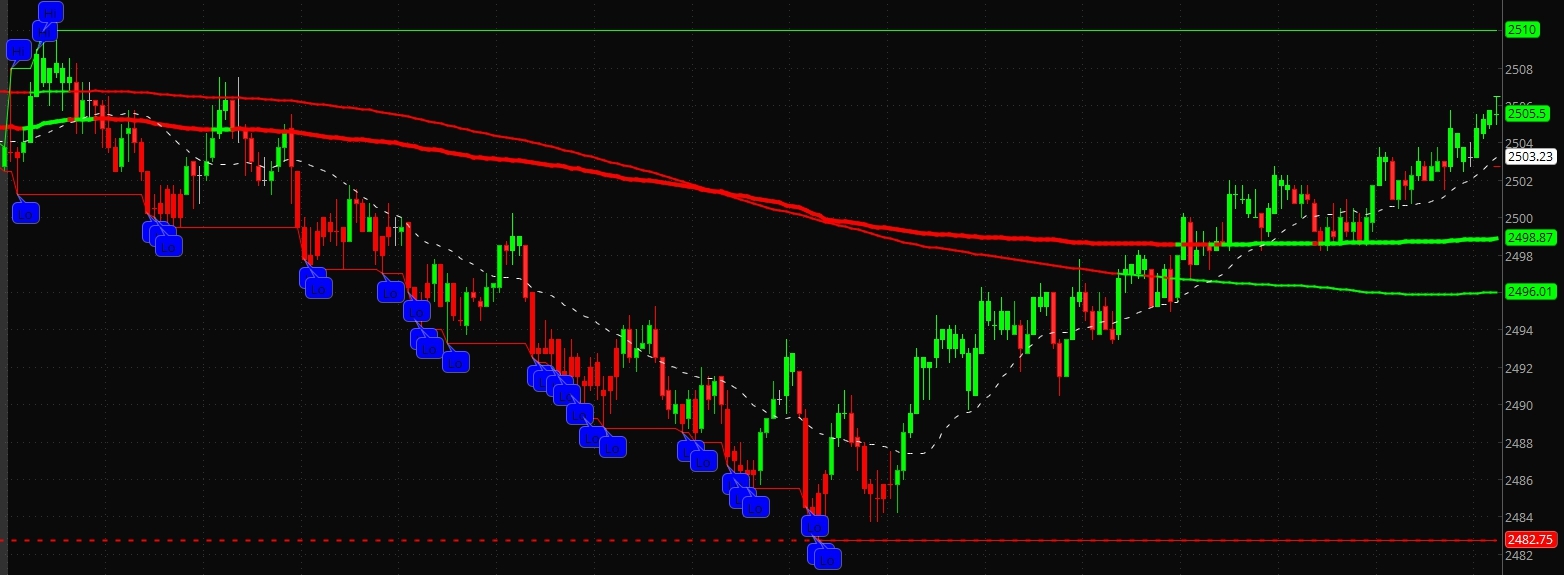
Hi Pete, Reposting as you requested with a bit more clarification. I wanted to know if there was a way to count intraday Hi and Lo’s that a ticker makes makes intraday. For example, I use Charles Schwabs Street Smart edge Scanner and it told me as of right now, CCCL has 118 Daily highs and 1 daily low, this may change by the time you read this question. This may also simplify it for you. On your script – Chart_DlyHiLo_24hr you are able to count them, but you’re using bubbles. I’m trying to turn that into a number, the number of Hi and the number of Lo onto a addlabel. Screenshot attatched to what i’m looking at – /ES
Thanks again You are going to have to post this question again. There was no trade data for Dec 29th so I have no way to view what you have described. Please include a screenshot showing what you are requesting. And please explain in more detail. Are you just wanting to count each time it makes a new high on the day? Or does each high need to also be a new all time high? Get the difference? Attachments:
Marked as spam
|
|
Private answer
Since you mentioned our custom chart study named Chart_DlyHiLo_24hr I want to make sure visitors to this post know where to find that code. Actually instead of that chart study I am going to link to version 2, since it provides more features and addresses issues brought up by our viewers. So the new version is named Chart_DlyHiLo_24hrV2b and the link to that video is: https://www.hahn-tech.com/thinkorswim-alert-high-low-version-two/ The code I provide here requires that you view that video and download the chart study for version 2. There are a lot of features in that chart study and without viewing the video you will be lost. After downloading and importing that study you will then go to the very last line in the code and paste this code to the very bottom:
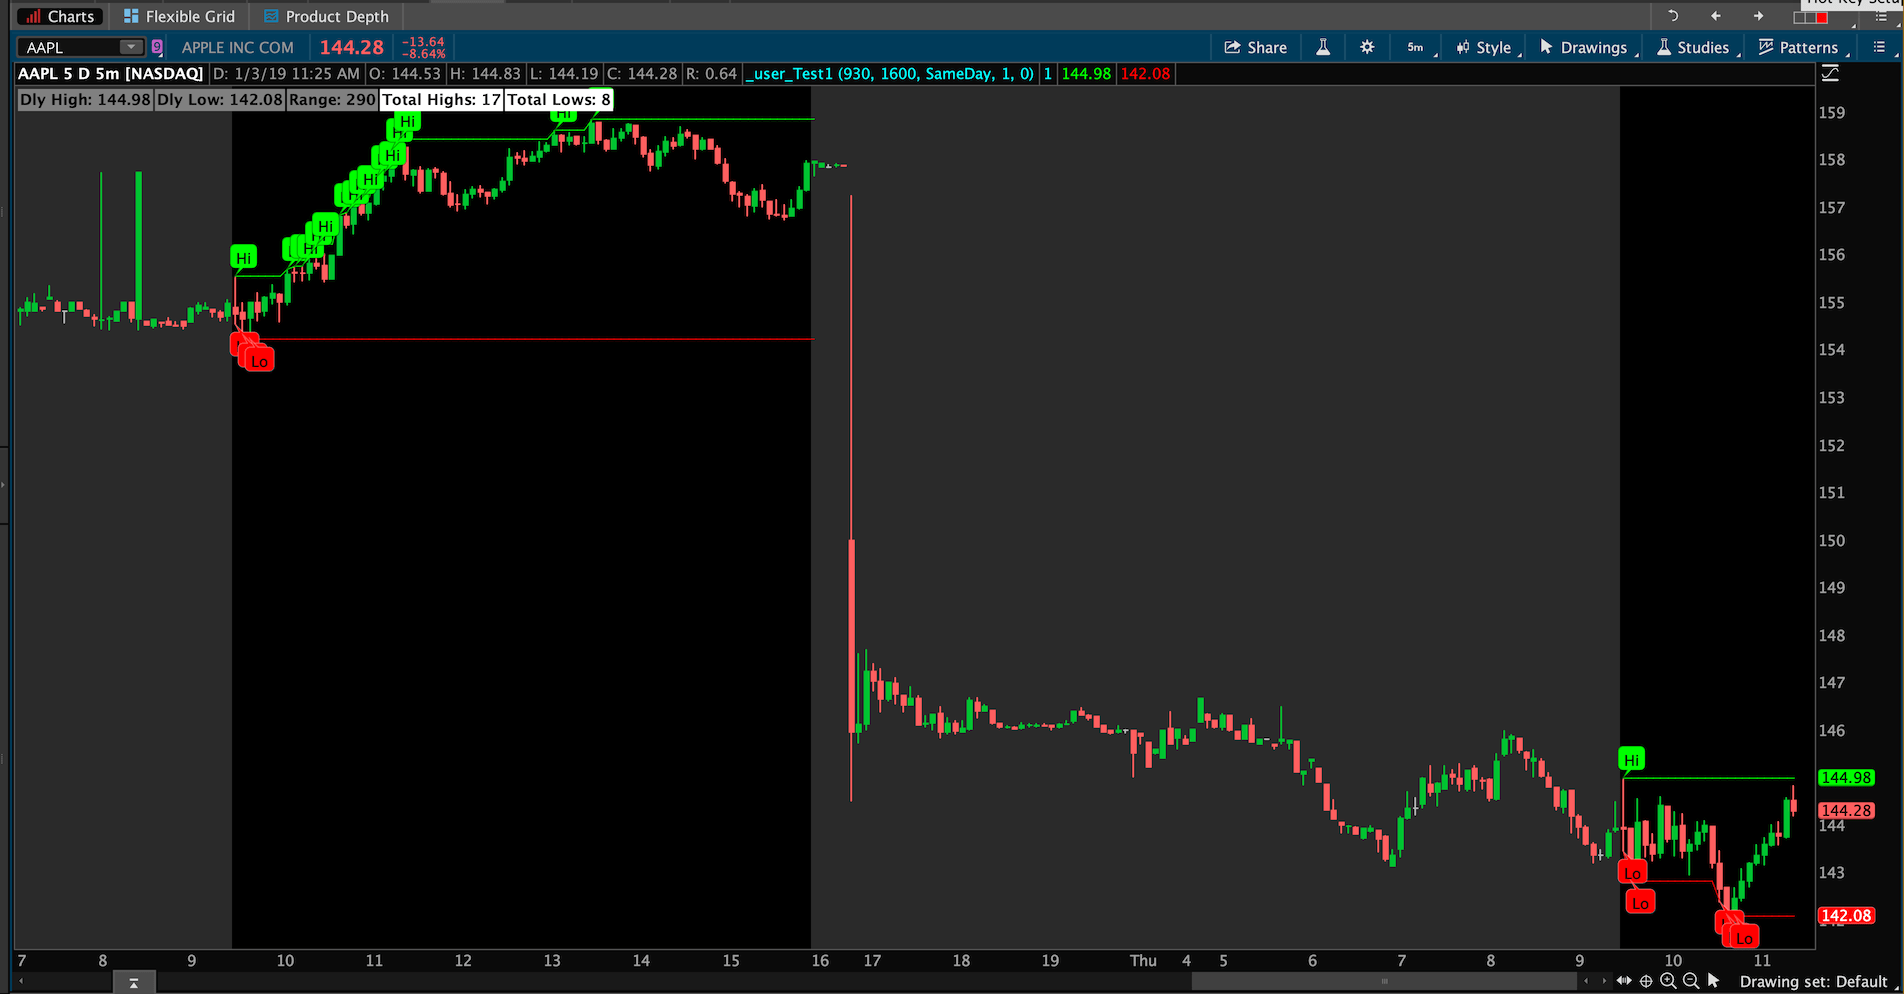
The same user inputs which control the number of days for which highs and lows are plotted will also control the total count of high and lows. In the screenshot below I have it set to display highs and lows only on the last two days. So the totals shown in the white colored labels reflect the last two days of intraday highs and lows. Attachments:
Marked as spam
Answered on January 3, 2019 9:38 am
|
Thanks for reposting. This is much better. Although I am going to change the title of the question to help our other viewers understand the context of your request before they click to view. The new title will be: “Count number of new intraday highs and lows”
One last bit if clarification. When you say: “CCCL has 118 Daily highs and 1 daily low”. Over what period of time is that measured? Seems impossible for that to be a single day. And you say you want to count intraday highs and lows. So I am guessing you want to accumulate the some total of intraday highs and lows over a period of days/weeks/months?
It’s just measured over a period of just that single day. Yes, I’m trying to accumulate them in just a day, from premarket to the market close. Pretty much the same as your “Chart_DlyHiLo_24hr” script. Essentially just counting how many [new] highs/lows in the current day day in a number format.