| ♥ 0 |
I’m trying to put together a scan that will only be run extended hours (pre-market). It will simply compare the current after hours price with the previous trading day close. Here’s what I have:
My crude way to get the closing price of the last regular trading session ( RESOLVED
Marked as spam
Asked on January 15, 2018 11:49 am
5042 views
|
|
Private answer
The solution depends whether you are trying to work with Futures or Stocks. This solution will be provided for use with stocks. For this solution I am pulling code used in the following video: https://www.hahn-tech.com/thinkorswim-alert-high-low-version-two/ We must use a time value in order to look back and get the prior day close. But even after grabbing that closing value we must then carry that value forward into the next trading session. This requires us to use recursion. First, let’s see what it takes to mark the location of the previous day’s regular session closing price:
So we have a variable named
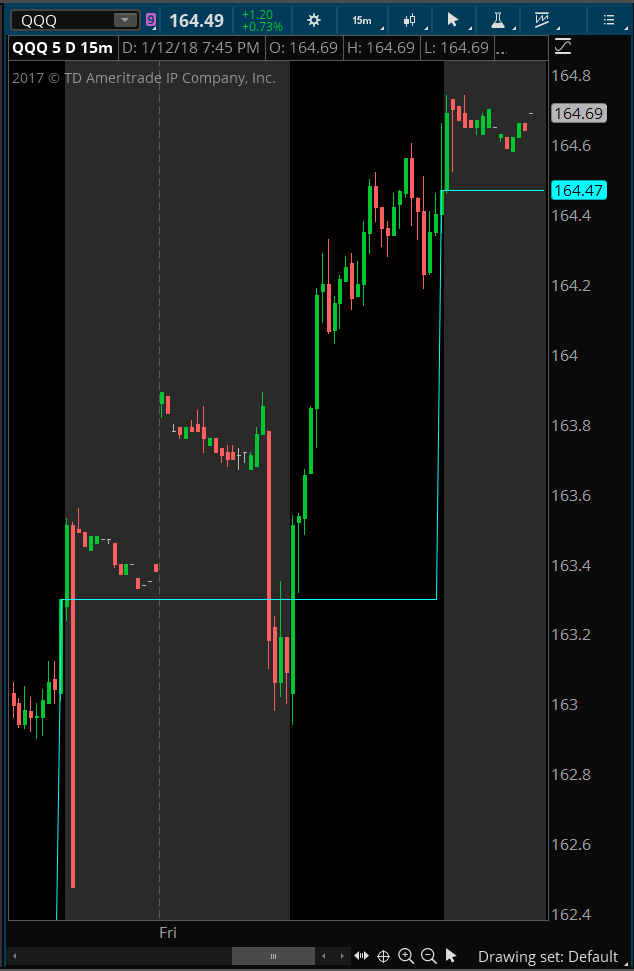
It helps if we can visualize things so let’s add one more line of code to plot that
Screenshot is included below showing how this plots. IMPORTANT NOTE:The scan engine in Thinkorswim does not use local time zone. So be sure to realize this when setting the time. In this example I have the time input set to 1600, which is Eastern time zone. Which is required for running scans, regardless where you are located. This may be subject to change in the future. So if you run into issues you can’t explain through other means, consider playing around with the time input so see if they have changed this requirement. Attachments:
Marked as spam
Answered on January 15, 2018 2:47 pm
|
Is there a way to see the exact code all put together in a form I could copy paste? Still learning the ins and outs of this thinkscript but this is exactly what I am looking for.
Sure thing. In fact I already did this in response to a later post. Look for the answer I posted on April 10, 2018. https://www.hahn-tech.com/ans/help-making-pre-market-gap-scanner-more-efficient/