| ♥ 0 |
Hi Hahn, I have a question regarding a script that I need to modify. Its a simple script which plots high and low on different time frames. plot hh = HighestAll(high); I am trying to add an alert to this script which can alert everytime a new high or new low is hit on a 20 day 1HR chart and 5 day 15 mins chart or any other time frames. I tried multiple ways but didn’t work. Could you please help me out? Also, I want this alert to work on a scanned watchlist which gets updated dynamically.
Marked as spam
Asked on September 10, 2020 7:29 pm
818 views
|
|
Private answer
The original question title you entered has been changed. The original title you entered was "Not able to generate alerts for conditions". The new title describes the context of your request. Now let's see if we can help you out here. those two lines of code you provided are completely useless. So throw those in the trash bin. The reason why is that those statements read the entire chart and return the highest high and the lowest low for the EVERY bar on the chart. When prices make a new high or low on the chart, the output of the code you have is immediately updated to reflect that new high. So there is no way to compare the current new high to the previous. Maybe this explains it more clearly: The current high can NEVER be higher than the HighestAll(high). The current low can NEVER be lower than the LowestAll(low). However you can use a very similar function that returns the highest value over a period of bars. The same function is available for the lowest value over a period of bars. But before we go down that path you need to understand something about time frames. You have listed two time frames, 1 hour and 15 min. The number of days included on the chart is not part of the time frame. The number of days on the chart is the time SPAN. Why does this matter? Because when you are working with any of the tools on Thinkorswim such as Scans, Study Alerts, Watchlist columns.... None of those tools allow you to set the time SPAN. The time SPAN for those tools are fixed based on the time FRAME you have selected. And the time SPAN for those tools can never match what you are able to select for a chart. So when you deal with time frames, take the time SPAN completely out of the picture. It will make your life much easier. Perhaps I can explain this more clearly. If you write code specific to the amount of time you have loaded on the chart (the time span), you will never be able to get that code to work correctly in any of the other tools on Thinkorswim. So all of the code you write needs to work the same exact way whether your chart contains 10 days, 20 days, 1 year, 2, years.... any time span you can select. Please make sure you understand everything I just explained because until you do you will not be able to understand how any of this works. A very simple alert for new high looks like this:
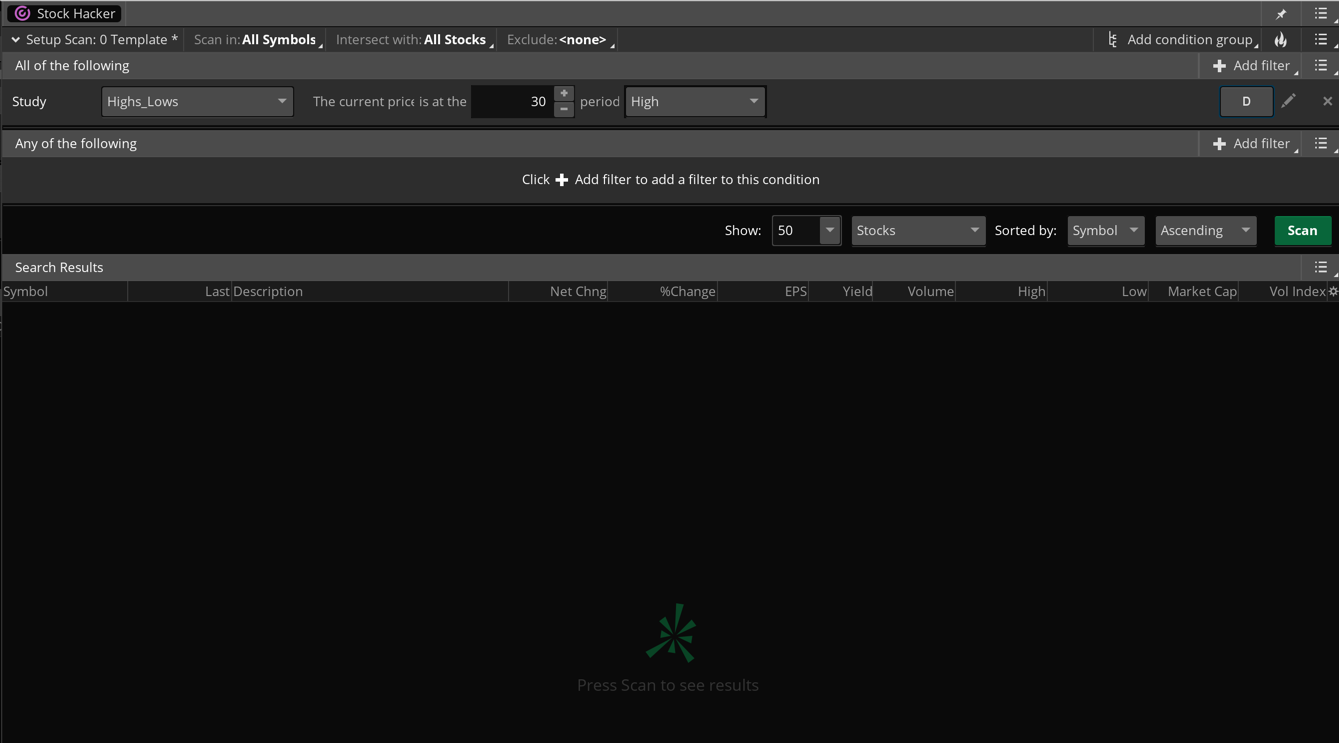
In plain English that says: return stocks where the current high is greater than the highest high from the last 10 bars, excluding the current bar. Now if all you need is a chart study that provides alert for new intraday highs and lows we have already published that solution here: https://www.hahn-tech.com/thinkorswim-alert-high-low-version-two/ However I do understand you are asking for a dynamic watchlist. Which is actually scan. So you need a scan that returns a list of stocks making new highs or new lows. Well that is already a built-in study filter on Thinkorswim Scans. Screenshot below shows how to set this up.
Attachments:
Marked as spam
Answered on September 11, 2020 8:49 am
|