AvgDailyRange for Expected Intraday Move – Targets


Category:
0
1

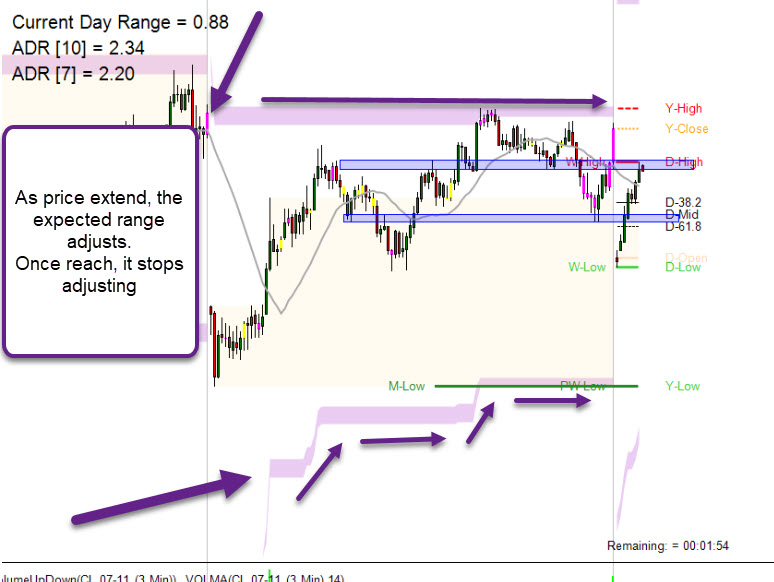
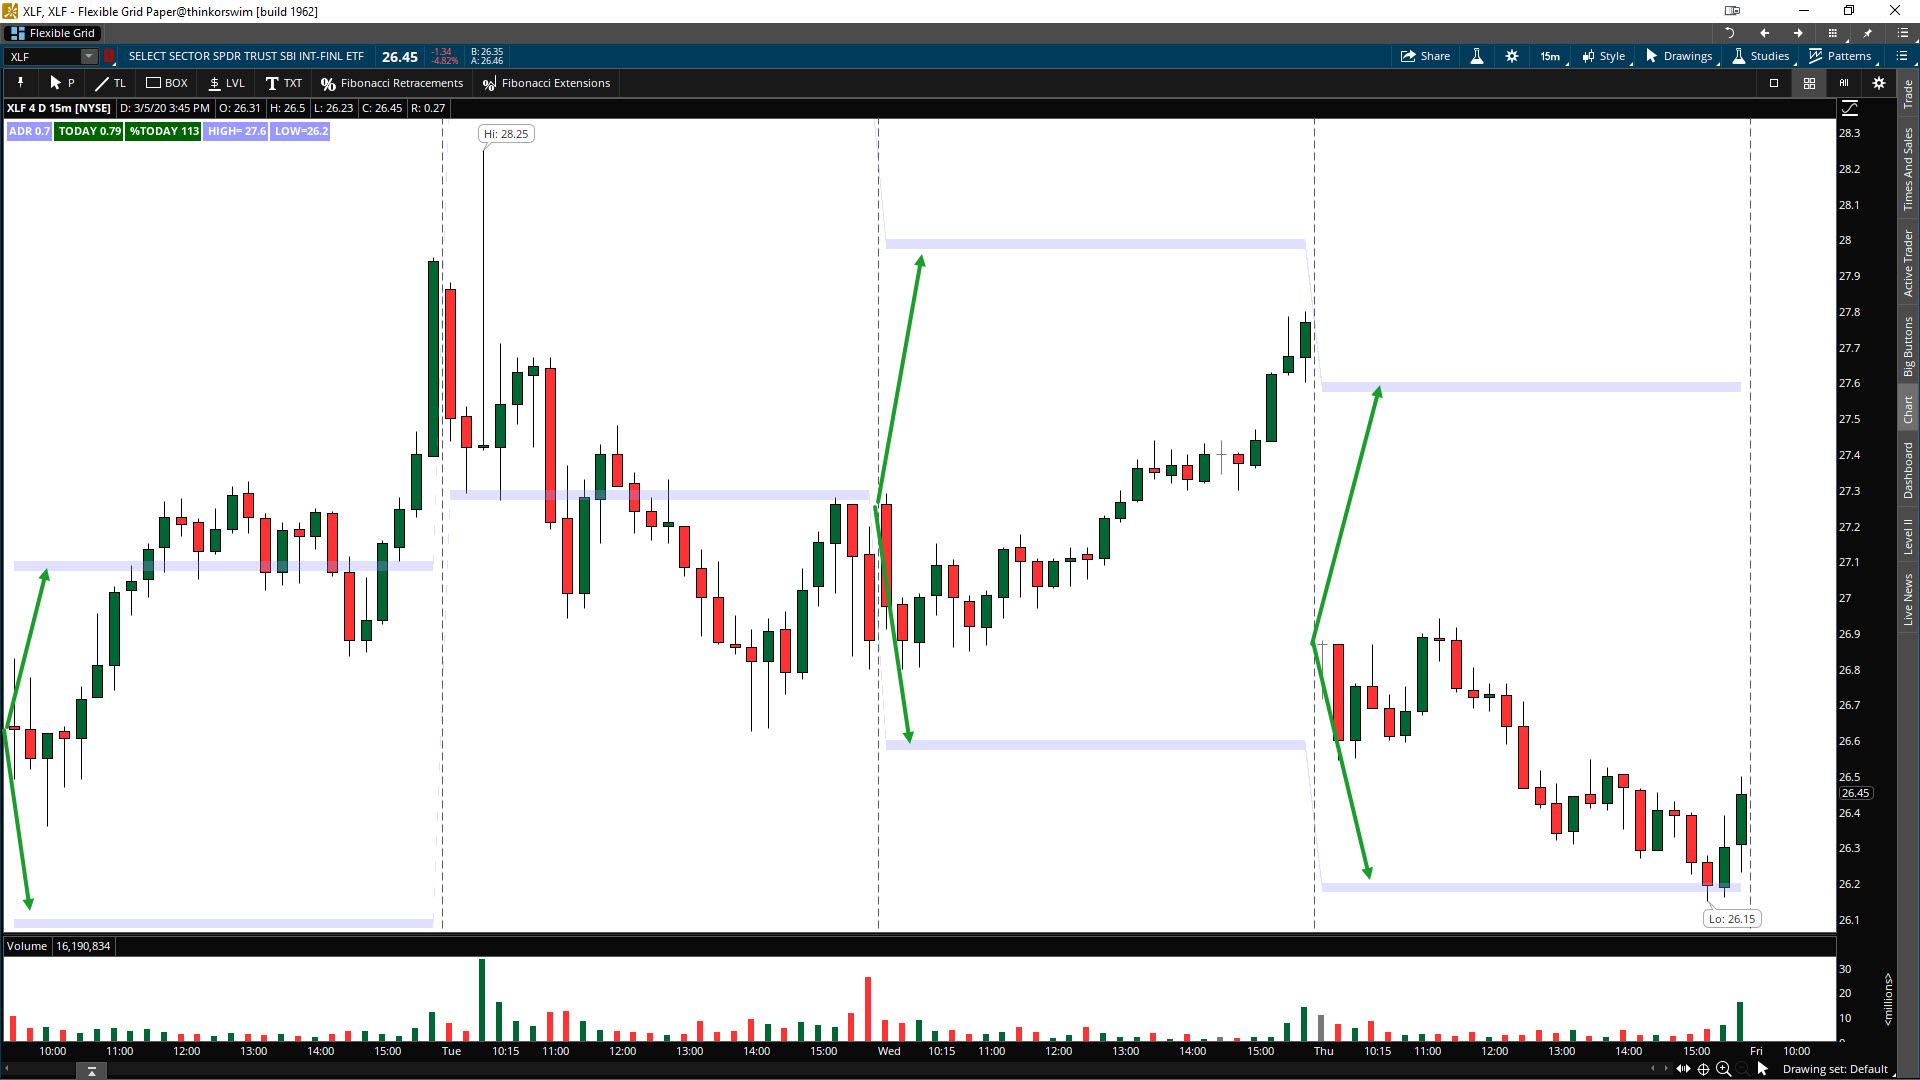
Hi. Again thanks a lot for your support. I believe this Study can help a lot of traders to set realistic expectations for Intraday movement.

I got a Study that calculates ADR (AvgDailyRange) from past (x) days and then plots a line (I made it a band) from the OPEN. This band remains fixed all day. It’s an initial estimate of the potential move of the stock based on avg range. Attached ADR.jpg. Great to define reasonable intraday targets.

The BEST use though is to consider the Low of Day and High of Day at each bar, instead of off the Open. If I replace “Open” with “Low” or “High” the plots adjust accordingly BUT they plot the same horizontal line adjusting to last value.

First Question: ¿Is there a way to get the bands plot each bar (vs a horizontal band updating based on last/new values)?. Attached ADR Example NT.jpg, as I used to have this on Ninja Trader many years ago.

So bands would be dynamic each bar :  Target_ADR_High =Low[0] + ADR // Target_ADR_Low = High[0] – ADR

The second request is more simple, even if the first one is not feasible. Study had an Input: “Show Only Last Period: yes”, to avoid plotting on previous days, but it’s missing the rest of the code. And I can’t get around it to use an IF THEN statement to filter this.

Below the code, which I tried to show as neat as possible as per your suggestions before. Hope you can teach us how to solve this. THANKS !!!

input aggregationPeriod = AggregationPeriod.DAY;
input ADRLength = 14;
input showOnlyLastPeriod = yes;
input OnlyShowStartTime = 930;
input OnlyShowEndTime = 1600;

# Defines de period in which the study will plot to avoid showing during extended session
def ShowPeriod = SecondsFromTime(OnlyShowStartTime) >= 0 and SecondsTillTime(OnlyShowEndTime) > 0;

# (1) Define Current Day’s Range, (2) AverageDailyRange for 14 days, (3) Actual % Range for the dayRange (1 / 2)
def dayRange = (high(period = AggregationPeriod.DAY)[0] – low(period = AggregationPeriod.DAY)[0]);
def ADR           = round((Average((high(period = AggregationPeriod.DAY)[1] – low(period = AggregationPeriod.DAY)    [1]), ADRLength)),1);
def pctADR      = round((dayRange/ADR)*100,0);

#Plots Value CALCULATED from the OPEN as a FIXED Level throughout the day
plot Target_ADR_High = if ShowPeriod then round((open(period=”day”) + ADR),1) else double.nan ;
plot Target_ADR_Low = if ShowPeriod then round((open(period=”day”) – ADR),1)else double.nan ;

#Format the level as a “BAND” with a 0,1% size
AddCloud(Target_ADR_High, Target_ADR_High*0.999, Color.VIOLET );
AddCloud(Target_ADR_Low, Target_ADR_Low*0.999, Color.VIOLET );

Target_ADR_High.SetDefaultColor(Color.GREEN);
Target_ADR_Low.SetDefaultColor(Color.GREEN);

#Plots Labels on Chart with Color Coding
AddLabel(yes, “ADR ” + ADR, COLOR.violet);
AddLabel(yes, ” TODAY ” + dayRange, if pctADR < 80 then color.GRAY else if pctADR > 100 then color.dark_green else color.LIGHT_GREEN);
AddLabel(yes, ” %TODAY ” + pctADR, if pctADR < 80 then color.GRAY else if pctADR > 100 then color.dark_green else color.LIGHT_GREEN);
AddLabel(yes, ” HIGH= ” + Target_ADR_High , COLOR.violet);
AddLabel(yes, ” LOW=” + Target_ADR_Low, COLOR.violet);

Attachments:
RESOLVED
Marked as spam
Posted by (Questions: 4, Answers: 8)
Asked on March 6, 2020 1:44 am
289 views
0
Private answer

Thanks for posting this. However I believe this will take quite a bit more time than I permit for providing free solutions in the Q&A forum. So about all I have time for is to offer some suggestions.

I'm not sure if I understand the first question. You seem to be asking how to get these horizontal lines to be adjusted based on the current high of day and low of day. I believe your code already contains this information and you only need to plug that into your mathematical computations to achieve this.

As for the second request, you can see how I accomplished this in the code provided with the following video:

https://www.hahn-tech.com/thinkorswim-alert-high-low-version-two/

Perhaps that will give you an idea how to incorporate this into your code.

Marked as spam
Posted by (Questions: 37, Answers: 4091)
Answered on March 6, 2020 12:04 pm
0
Pete.Tks for your comments. I will review this link to see if I can apply it. Regarding the first question, I now I can change the math to base the calcs on Low / High. What I don’t know how to achieve is what I BELIEVE is a solution: to base the calculations on a Minute Aggregation vs a Daily, so each bar will plot and stay fixed, and the next bar will be a new plot, that could be the same value as prev bar or not. I understand your time constraints for free advice. I was going to make a voluntary contribution nevertheless after some time, as you really helped a lot, but I can do that now if it helps. And if not, I can ask for a quote for the work, as I really want to get this done. It’s a key part of my trading arsenal. Tks. (Edit)PS: I did not check the code yet, but saw the video and I believe my initial idea could work by adding / substracting ADR to the high / low levels plot there. Will check it tomorrow (Asia time) Tks.
( at March 6, 2020 9:46 pm)
0
Yes, we do provide professional services and we refer to this as a custom project request. I try not to advertise this because despite hiding this on the website I already receive all the custom project requests I can manage. You can get all the details here: https://www.hahn-tech.com/about/
( at March 7, 2020 8:20 am)
0
Pete I got to a solution thanks to your videos. I took many hours but with patience and trial & error I got it. Do you allow me to share this? Is it better to do it copying the code or I can attach the .ts file? Also feel free to review it, optimize it and / or improve it if you feel like. Just ask you to update to me if so. I believe it is a great tool to establish reasonable expectations for future movements. Tks.
( at March 9, 2020 10:58 pm)
0
As long as this solution complies with our Terms and Conditions you can submit your code as a new solution to your question. Here is a link to our Terms and Conditions: https://www.hahn-tech.com/terms-and-conditions/ The main goal here is to ensure this code is not violating any intellectual property rights. For example we do not permit any attempts to reverse engineer copyrighted/premium chart studies.
( at March 10, 2020 7:11 am)
0
Private answer

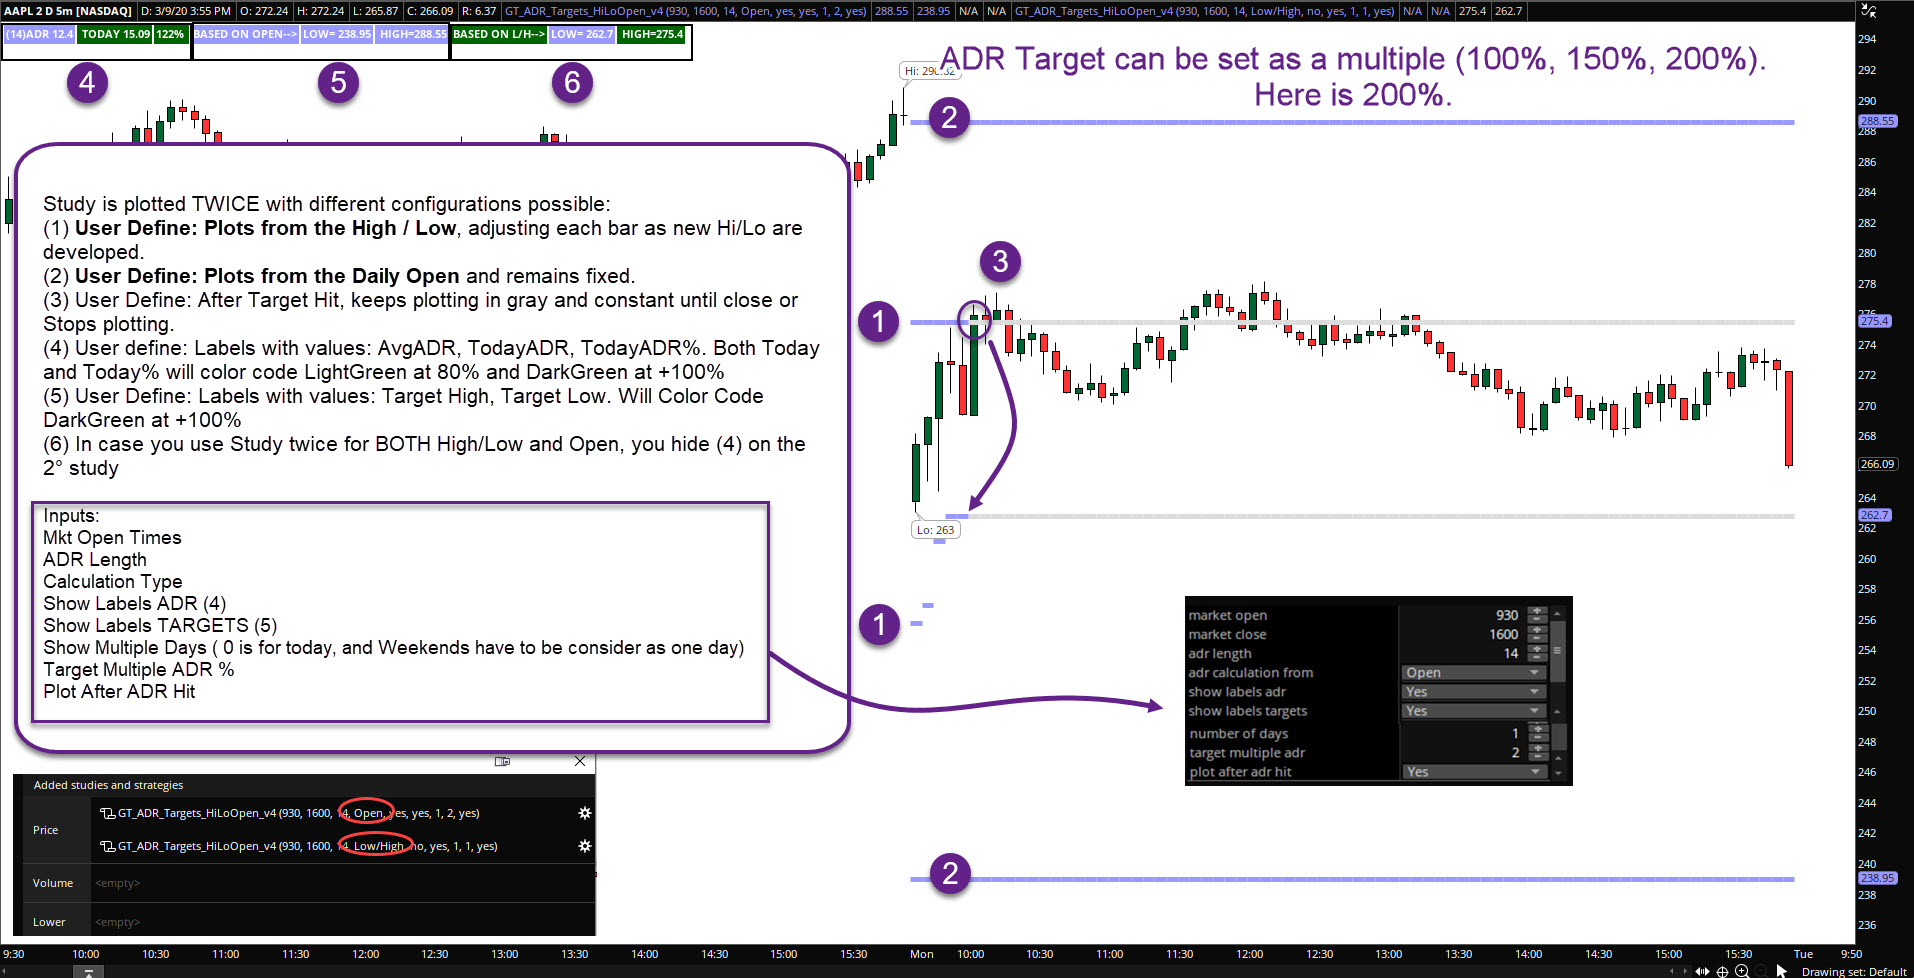
So as this was adapted from a free public ADR Study I got and I managed to modify it as I needed with the help of Pete, I am sharing the final code, together with a basic explanation of features and how it works attached.

Hope you enjoy. You can send your comments to [email protected] / @gtichauer (Tweeter).

PS: If someone gets to improve/optimize the code pls let me know.

GT

Marked as spam
Posted by (Questions: 4, Answers: 8)
Answered on March 12, 2020 10:59 pm