| ♥ 0 |
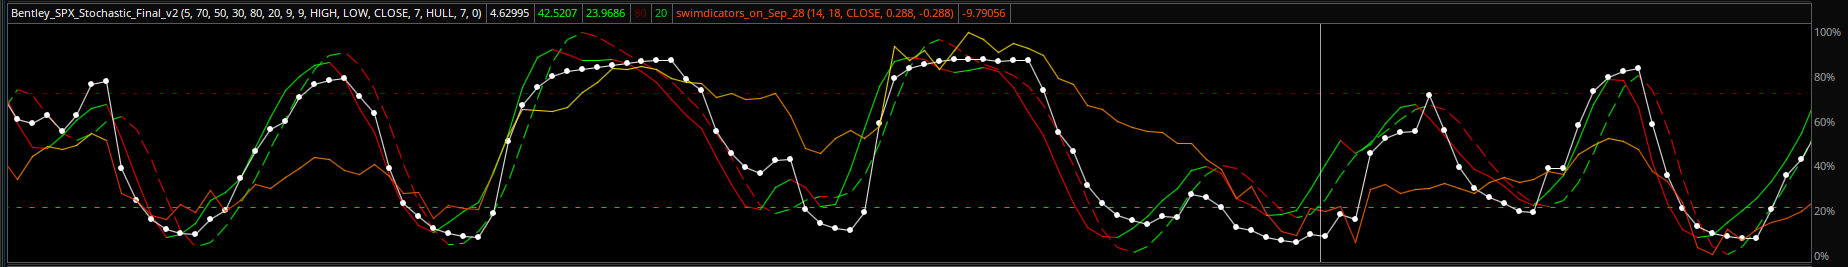
Hello, I have been trying to merge/combine these 3 indicators in to one indicator. I can successfully plot the STO and RMI, but when adding the DPO it does not plot correctly, it plots in the lower half of the indicator which is not accurate, I believe it has to do with the values of how the DPO plots, compared to STO and RMI. Please review the code and let me know if this will be possible. I have included an image of how it should look… this is when I just combined them in the TOS tool, by having the STO/RMI in the same lower level combined with DPO. I want to eliminate the need for doing this and have them as a single indicator. # Bentley_DPO_RMI_STO_v1
declare lower;
########### #DPO Settings ###########
input colorNormalLen = 14; input length_DPO = 14; input price = close; input OverBought_Value = 0.288; input OverSold_Value = -0.288;
plot DPO = price – Average(price[length_DPO / 2 + 1], length_DPO); def abs = AbsValue(DPO); def normVal = FastKCustom(abs, colorNormalLen); DPO.assignValueColor(createColor(255, (240 – (100 – if DPO > 0 then normVal else -normVal * 175 / 200)), 0));
########### #RMI Settings ###########
input momentum_RMI = 5; input length_RMI = 7;
assert(momentum_RMI > 0, “‘momentum’ must be positive: ” + momentum_RMI);
def emaInc = ExpAverage(Max(close – close[momentum_RMI], 0), length_RMI); def emaDec = ExpAverage(Max(close[momentum_RMI] – close, 0), length_RMI); plot RMI = if emaDec == 0 then 0 else 100 – 100 / (1 + emaInc / emaDec);
RMI.SetDefaultColor(GetColor(1));
########### #STO Settings ###########
input KPeriod = 9; input DPeriod = 9; input priceH = high; input priceL = low; input priceC = close;
input over_bought = 80; input over_sold = 20;
input slowing_period = 7; input averageType = AverageType.HULL;
input length = 7; input displace = 0; def Trnd = Average(close[-displace], length);
def c1 = priceC – Lowest(priceL, KPeriod); def c2 = Highest(priceH, KPeriod) – Lowest(priceL, KPeriod); def FastK = c1 / c2 * 100;
plot FullK = MovingAverage(averageType, FastK, slowing_period); plot FullD = MovingAverage(averageType, FullK, DPeriod);
plot OverBought = over_bought; plot OverSold = over_sold;
FullD.AssignValueColor(if FullD > FullD[1] then Color.GREEN else (if FullD == FullD[1] then Color.GREEN else Color.RED)); FullD.SetLineWeight(1);
FullK.AssignValueColor(if FullK > FullK[1] then color.GREEN else color.RED); FullK.SetLineWeight(1);
OverBought.SetDefaultColor(GetColor(1)); OverSold.SetDefaultColor(GetColor(1));
Attachments:
Marked as spam
Asked on March 5, 2019 6:46 am
187 views
|
Hello, does anyone have any idea of how I could proceed? Thanks
Pete, any advice? Your input will be appreciated.
A severe health issue prevents me from working at this time. Surgery is scheduled for March 6th and should begin my recover process. I will take a look at this request once I regain my strength. More details and updates provided here:
https://www.youtube.com/watch?v=eNONabTTWEk
https://www.gofundme.com/pete-hahn-2019-medical-expenses
Thanks for your patience.