| ♥ 0 |
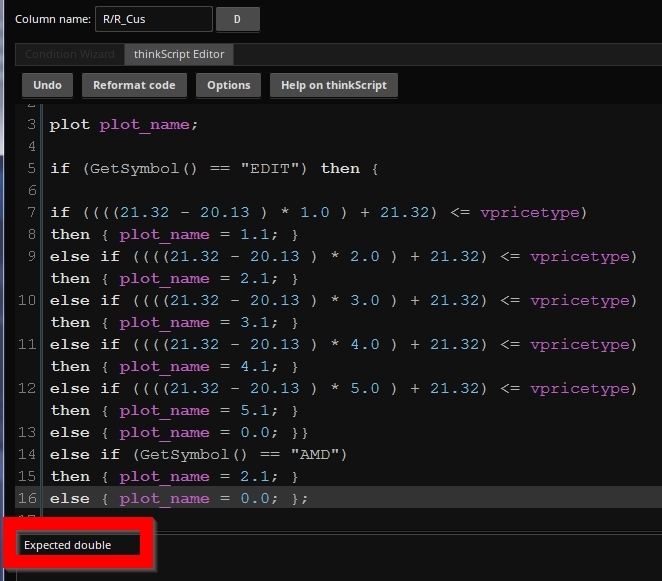
Hello, I am trying to add a custom column on a watchlist but I am getting error “expected double”. I am not able to figure out what I am doing wrong. Here’s the code below.. input vpriceType = PriceType.MARK; plot plot_name; if (GetSymbol() == “EDIT”) then { if ((((21.32 – 20.13 ) * 1.0 ) + 21.32) <= vpricetype) then { plot_name = 1.1; } else if ((((21.32 – 20.13 ) * 2.0 ) + 21.32) <= vpricetype) then { plot_name = 2.1; } else if ((((21.32 – 20.13 ) * 3.0 ) + 21.32) <= vpricetype) then { plot_name = 3.1; } else if ((((21.32 – 20.13 ) * 4.0 ) + 21.32) <= vpricetype) then { plot_name = 4.1; } else if ((((21.32 – 20.13 ) * 5.0 ) + 21.32) <= vpricetype) then { plot_name = 5.1; } else { plot_name = 0.0; }} else if (GetSymbol() == “AMD”) then { plot_name = 2.1; } else { plot_name = 0.0; };
Attachments:
Marked as spam
Asked on March 4, 2019 2:12 pm
608 views
|