| ♥ 0 |
Pete,
Thanks for all your hard work!
I’m trying to add a custom watchlist that counts the length of a current TTM Histogram trend and resets to zero at any inflection points. The following works as a study, but gets stuck as “loading” when I add it as column in a watchlist. I have changed the aggregation and afterhours settings. <pre>declare lower; def hist = TTM_Squeeze(price, length, nK, nBB, alertLine).Histogram; plot data = trend;</pre>
Marked as spam
Asked on March 5, 2017 6:11 pm
737 views
|
|
Private answer
Ok, so you need a variable that serves as a counter. This is something that comes up very often in the custom projects I do for clients. I see from your code that you are using recursion (referencing trend[1] + 1), which is a required step. But nowhere in your if/then/else statement do you provide for a reset of the counter. Right? Some condition should be used to set the count back to 1, then some other condition should be used to add +1 to the counter. So, here is how I would do it, using your code as the basis. After deleting the last to lines of code…. First I determine what constitutes a trend. And I set that up as it’s own separate variable. It makes the code easier to read and easier to troubleshoot. From your code, it appears you only count a trend if you have two bars of the histogram in the same direction:
You don’t need the parenthesis so we’ll just ditch those. Then we’ll do the other side of that like so:
Next, we’ll create variables for each side that will initiate the counter. This is structured so that it is true only when we have encountered the first bar in which an uptrend or downtrend has been encountered.
Explanation: We use the bang (!) operator to test if a condition is false. Putting the ‘!’ in front of a true/false variable is the same a saying NOT EQUAL. You can see we are using the value in the brackets to reference the previous bar. So we are saying: “If previous bar was NOT upTrend and current bar IS upTrend then true, else false. Got that? At this point we have broken things down into the required pieces. Let’s assemble the counters:
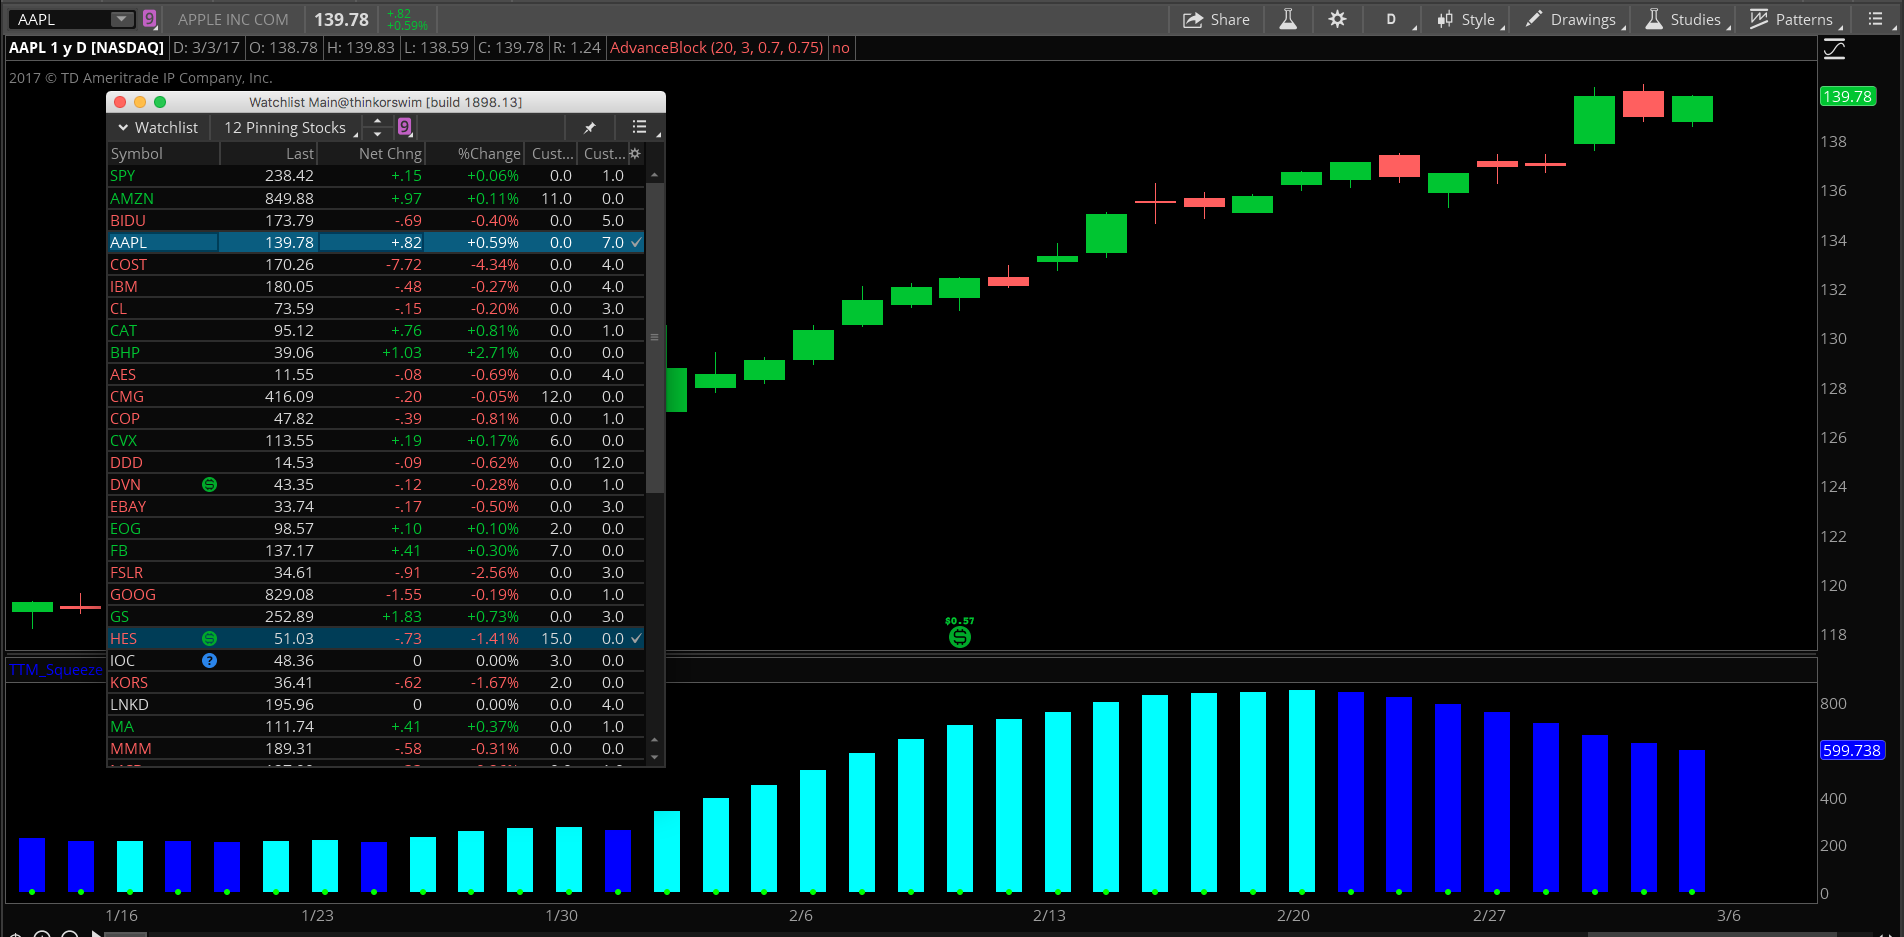
Whenever you use recursion it is best to apply ‘rec’ in place of ‘def’. This is not required but makes the code more reader friendly. Another ‘best practice’ when using recursion is to invoke the CompoundValue() function. Read more here: http://toslc.thinkorswim.com/center/reference/thinkScript/Functions/Others/CompoundValue.html But don’t get lost in those details. The meat of this code is found in the if/then/else function. Notice I have nested a second if/then/else within the first. So it’s actually… (if/then/else if/ then/else) Got that? The first if checks if we have a brand new uptrend and resets the value to 1. The else/if section checks if we have a current uptrend in place and adds 1 to the counter. The final else resets the counter to zero. Attached screenshot shows the fully assembled code applied to two custom columns in a watchlist. One column for uptrend and the other for downtrend. I’ve included a chart of AAPL for reference. Please be sure to add comments below if you have questions or need any of this explained in more detail. This was an excellent post and I’m sure it will benefit a large number of our viewers seeking to learn how write advanced code in Thinkscript. Be sure to up-vote any answer that bests solves your question. Attachments:
Marked as spam
Answered on March 5, 2017 8:42 pm
|
plot up = if upTrendCounter > downTrendCounter then upTrendCounter else if downTrendCounter > UpTrendCounter then 0 - downTrendCounter else 0;Study alerts cannot be added to watchlists. But you can add them to a custom scan. As of a few months ago, we can now add an alert function to a saved scan. We don’t have a video on this yet but I recorded one over the weekend. Should be published later today. And that custom scan would need to be filtered by a custom watchlist of your account positions. You would need to keep that custom watchlist up to date as positions are added or removed. Once you save a custom scan, it can then be selected as a watchlist. The scan will run dynamically in the watchlist gadget, adding and removing symbols as the scan runs.