Days Crossing Over 8 EMA, Green for UP and Red for Down


Category:
0
0

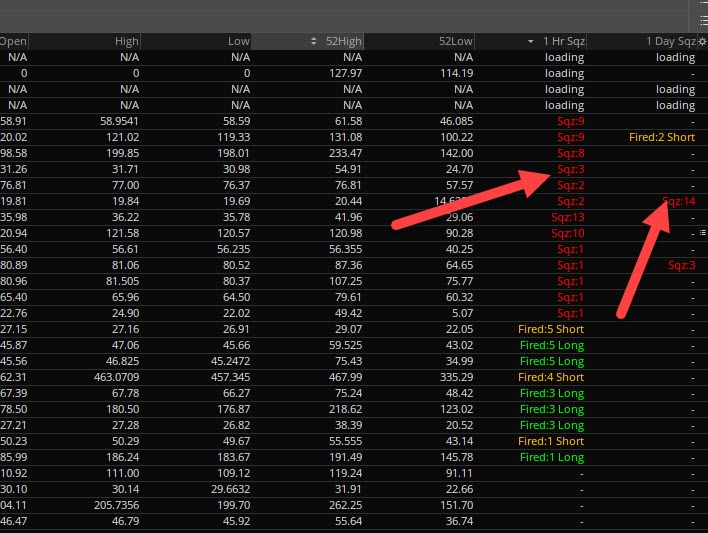
I would like to create a watchlist with the number of days the price as crossed up through the 8 day EMA and keep a count its been there, kind of like the Squeeze Watchlist like I have attached,

I would like to color it Green for above and Red for below.

Attachments:
Marked as spam
Posted by (Questions: 1, Answers: 0)
Asked on April 15, 2019 3:46 pm
142 views
0
Private answer

This should do the trick. If it is red and says zero, it is because the 8 EMA is currently below the stock price.


def EMA8 = ExpAverage(close, 8);

def price = close;

def regime = if close > Average(close, 200) and BarNumber() > 1 then 1 else 0;

# EMA8 Info

def m8s = if (low[1] <= EMA8[1] and low > EMA8) and regime then 1 else 0;
def m8x = if ((low < EMA8) or (close[1] >= EMA8 and high < EMA8)) and regime then 1 else if !regime then 1 else 0;
def m8 = if m8s then 1 else if m8x then 0 else m8[1];
def m8Bars = if m8s then 1 else if m8 then m8Bars[1] + 1 else 0;

plot EMA = m8Bars;

AssignBackgroundColor( if EMA8 > price then color.red else if EMA8 < price then color.dark_green else color.black);

Marked as spam
Posted by (Questions: 21, Answers: 47)
Answered on April 16, 2019 11:22 pm