| ♥ 0 |
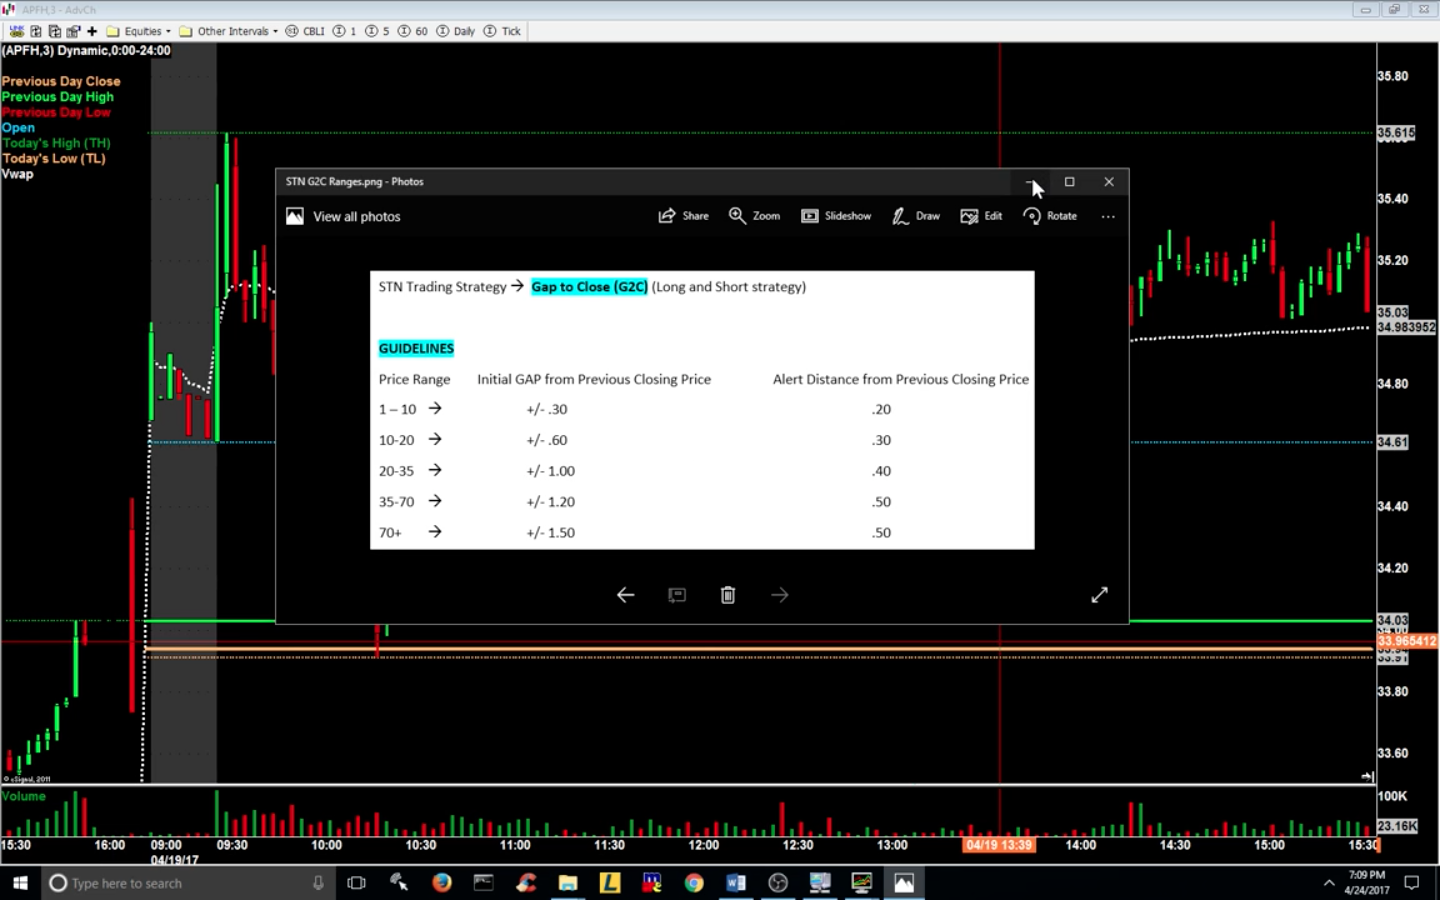
Hello everyone! I believe this could be easy but I am having trouble creating/modifying a script/scan that looks for stocks that meet the following criteria. Equities that Gap up, reverse to PDClose AND/OR Gap down, reverse to PDClose. The setup is stronger the closer PDC is to days HIGH or LOW S/R level. The attached image guidelines/metrics are used to determine which stocks meet G2C requirements. PT is 50% fib retrace. Pete – i really enjoyed your overnight range scan alert tutorial (was the range breakout video completed?) Your videos and enthusiasm have opened my eyes to the potential of TOS script. You make it look easy, the learning curve is steep so I really appreciate your efforts and helpful community. Thank you! Attachments:
RESOLVED
Marked as spam
|
|
Private answer
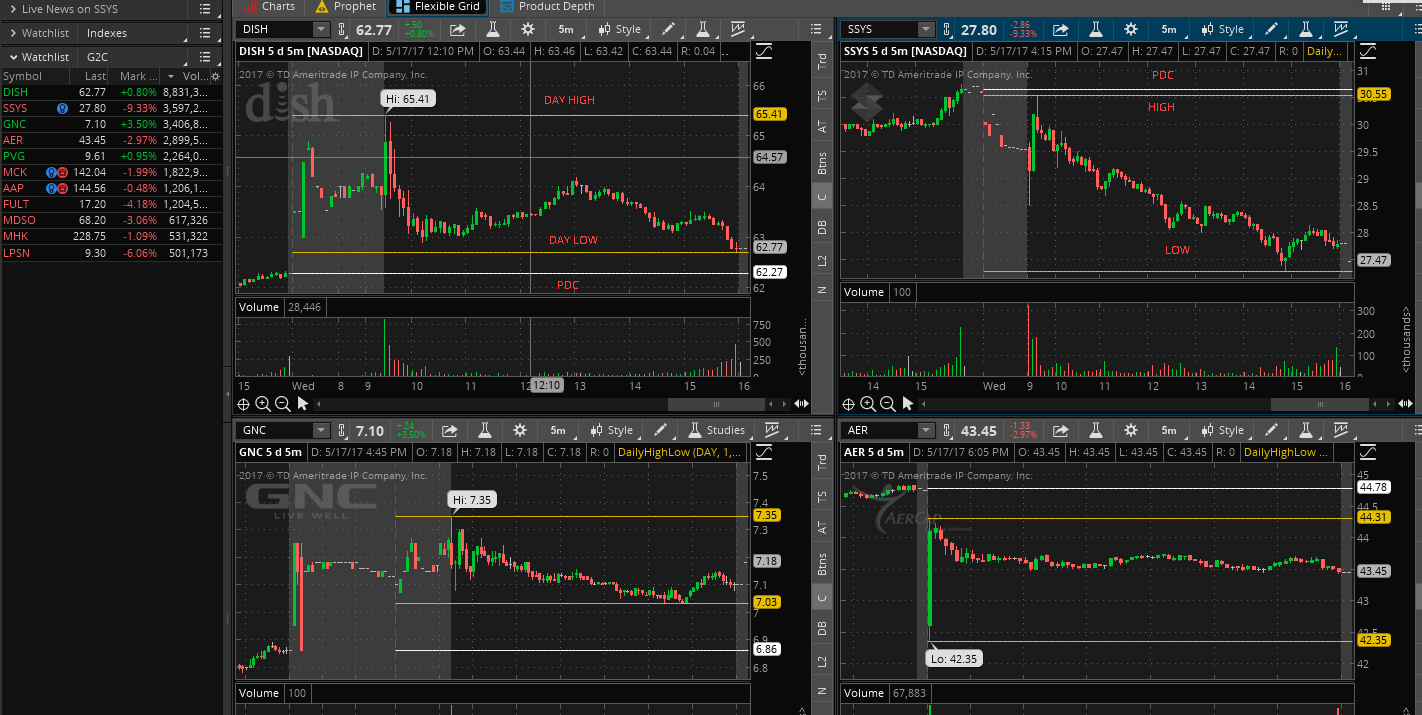
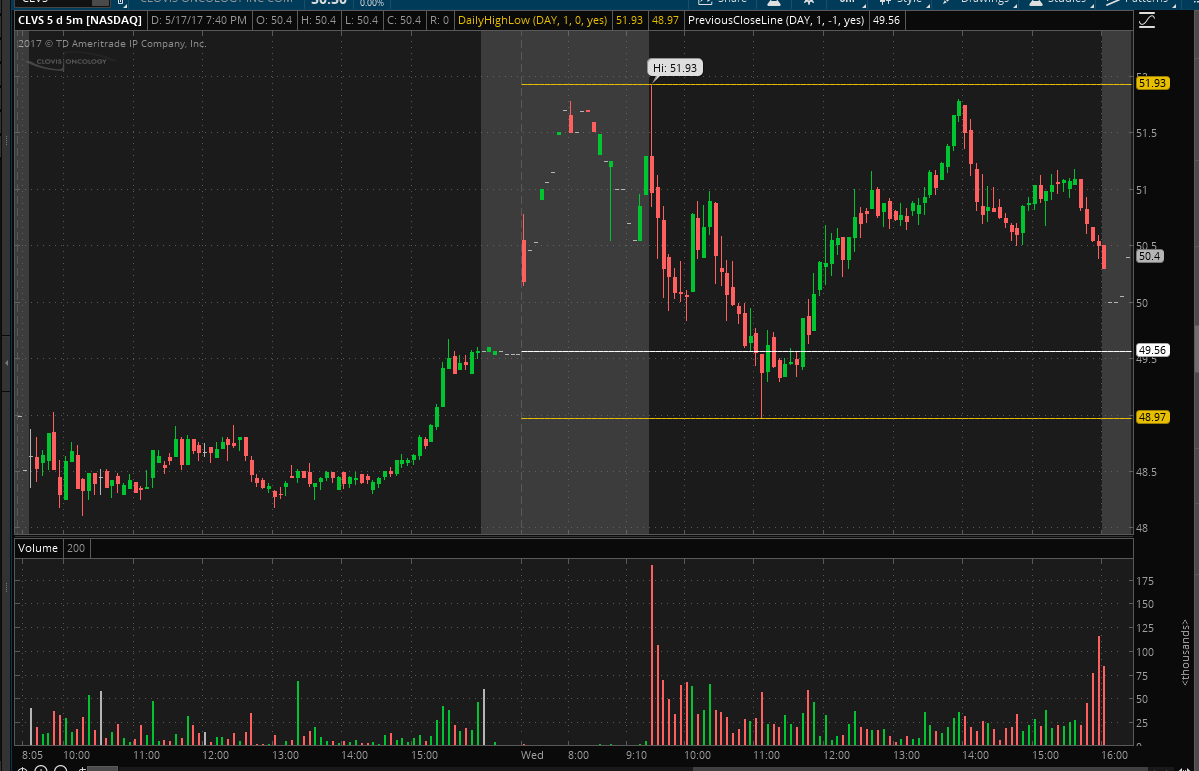
Pete, Thank you very much! I have had a lot of fun playing with your code today and analysing results. The code works very well and i’d like to run by you a couple of observations so i understand how this works, and behaves. I’m excited to see how this works during the trading session. I have attached two images. Image 1) Displays scan results (>500k vol) in a watchlist with 4 charts. 2 Left side results Gap Up and Right side 2 Gap Down. Gap Up (left side) look good. My first impression’s the Gap Down charts were providing errors since the setup near PDC was no-longer True. That said the Setup was True shortly after Open. Am i correct in thinking the scan keeps True results throughout the trading day even when the setup is no longer True? Image 2 displays my 2nd observation, a chart of CLVS with HL and PDC levels drawn. Clearly this would have been a great trade but i’ve struggled to adjust the code parameters to pick up CLVS in scan results. Hoping you know what I’m missing. Looking forward to further tests and analysis. Thank you and regards, Attachments:
Marked as spam
Answered on May 18, 2017 4:00 am
|
|||
|
Private answer
Thanks for provide a very clear description and including a screenshot for reference. Give this code a spin and let me know what you get. I tested it just a little bit and it seems to give results that you are requesting. But I don’t actually trade this so it’s up to you to give it a thumbs up or not. (hope the text formatting here doesn’t break the code structure. you might have some touching up to do)
Marked as spam
Answered on May 17, 2017 2:54 pm
|
I did forget to mention this code was created to run EXCLUDING extended hours trade. The scan is completely wrong if you check the box to include extended hours.
Hi Pete, hope all’s been well.
After a week of testing, tweaking and studying i’m excited to now be comfortable with your code and delighted with scan results. Also utilising TOS scan alert email feature which you highlighted during a tutorial has helped immensely in keeping track of it’s results during the trading day. I’m in Asia and unable to monitor markets all the time so found this feature very useful to analyse results.
Very glad to hear that. Thanks for taking the time to provide this feedback. Please be sure to Up-Vote the answer I provided so visitors to this post can quickly find the solution that worked best.
Hello Andrew, could you please share about ”At least one plot should be defined”, which plot and what time frame works better? Any advice will help. Thank you in advance.
Victor, at least one plot is required for a scan. So what you quoted there is an error which occurs when you fail to provide a plot statement in the scan code. To run the scan you would add the following statement to the code:
plot scan = gapDownCloseAlert or gapUpCloseAlert;
As to which time frames work best. Since it is a scan I would say it just depends on how often you want to be notified of potential trades. The time frame you select is not going to affect any of the levels. Another viewer posted a question on this same topic. They provided a link to a YouTube video. I cannot vouch for it’s efficacy but I think the video was published by the creator of this setup. https://www.youtube.com/watch?v=pV2GZWdB9U8
Pete, I found and started using this code a few days ago. I do see stocks using the scan but mainly only high price stocks appear. Using the first criteria as example 1-10 dollar stocks with .30 cent gap, does it have to be exact at .30 cents only or will it pick up .50 cent gap? Do I need to use a greater than or equal sign instead of just an equal sign in the code?
The code is already set to find gaps larger than or equal to.
def qualifiedGap = AbsValue(currentDayGap) >= gapSize;
Thank you Pete, if i wanted to ran a scan after market close using the code what would I need to add to code look back at today?
The code is designed to find signals as they are occurring throughout the day. If the scan is not run at the exact time a signal appears then no results are returned.
Take AAPL for example. On Tuesday 10/16/18 at 10:10 am ET, using a 5 min time frame, there was a signal generated by this scan. If you were to run the scan at 10:15 or anytime after that, it would not pick up that event. The event is a one bar event. The scan must be set to run continually throughout the day in order to detect each and every signal that appears in the list of stocks being scanned.
So to more directly answer your question. There is nothing you can change to run this after hours. That would be completely outside it’s intended purpose and use. Hope that clears things up.
I feel that you are getting “stuck in the weeds” here. That’s may term for describing what happens when you get lost along the way toward a solution. In this recent comment you have posted code that contains fatal errors. Errors that need to be corrected before any scan could be run.
If I understand your goal, you want the scan to pick up stocks below $12. The code I posted in the answer above already has “buckets” for that.
Bucket one: stocks >= $1 and < $10 with gap size greater than or equal to $0.30 Bucket two: stocks >= $10 and < $20 with gap size greater than or equal to $0.60 There are other buckets that cover higher priced stocks. If you only want stocks under $12 you can simply add a Stock Filter to the scan for close < 12. If the existing code does not perform what you are seeking you will have to explain. I went back and read your previous comments and from what I see the code does just what you are asking for. Perhaps you should watch the video that I linked on June 12th, 2017. The video was published by the author of this technique. It may be that your frustration is due to not understanding what the code was designed to do.
Pete, I did indeed just wanted to look at stocks under $12. I will add the filter to the scan as you stated and leave the code as written. I have watched the video a few times and I feel I understand what the code is trying to find. Thanks again, I enjoy reviewing some of the other scan answers you have provided on the site and testing them out.
https://www.hahn-tech.com/thinkorswim-custom-scan-stochastic-macd/
https://www.hahn-tech.com/thinkorswim-scan-macd-rsi-part-two/
https://www.hahn-tech.com/thinkorswim-scan-ichimoku/