High Relative Volume Scan


Category:
0
0

Hey Pete! I’m wondering if there’s a way to Scan for high relative volume? Maybe changing how far in the past the scanner looks, whether it’s daily or intraday. Maybe tos already has it? Thanks!

RESOLVED
Marked as spam
Posted by (Questions: 10, Answers: 14)
Asked on February 11, 2017 8:28 pm
4444 views
0

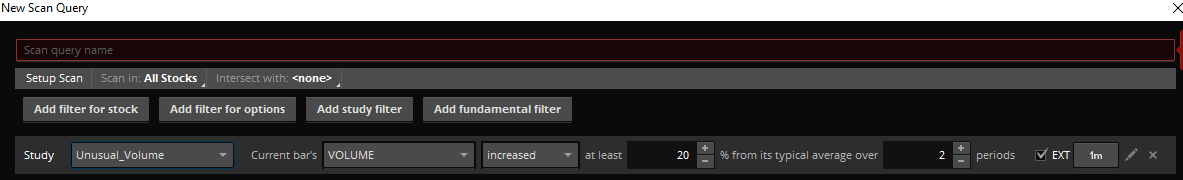
Before posting an answer let me make a few comments so we can get more details on what you are trying to do. ”High Relative Volume”, how do you plan to define that? We can use a moving average of historical volume as a baseline. But how do you want the scan to decide what is higher than relative? I’m assuming you mean higher than typical, or average. How much higher? 150%, 200%… some other value?

( at February 11, 2017 10:55 pm)
1
Private answer

I guess they already have it!

Attachments:
Marked as spam
Posted by (Questions: 10, Answers: 14)
Answered on February 11, 2017 11:36 pm
0

Awesome! You answered your own question.

( at February 12, 2017 9:20 am)
0
Is there a way to turn this into a filter for an existing scan, so you can sort by Unusual Volume?
( at January 29, 2021 10:30 am)
0
Well actually this is a scan. And scans can only return a list of stocks meeting the criteria. A scan is never able to "sort results". You do that by selecting one of the columns in the results section as the "sort by". So you add a column in the results section just like you do any of the watchlist gadgets and then click on it's name at the top of the column to sort ascending or descending.
( at January 29, 2021 10:54 am)
0
In my perspective TOS built in study is more effective for daily time frames, wherein, it will compare the current day volume with the average from previous x days. For intraday, such comparison will not give the desired result as intraday volume shifts dramatically throughout the day. What is needed is the following: compare the accumulative volume for this day with the average volume of previous days from the exact period of time. E.g. if now is 10AM, only consider the previous days volume from 9:30 to 10AM.
( at May 27, 2021 3:34 am)
0
The programming language of Thinkorswim lacks the tools required to create this sort of metric. Various attempts have been posted in this forum. None of them work as scans (too complex) and even the chart study versions are restricted to working on a single time frame.
( at May 27, 2021 7:04 am)