| ♥ 0 |
I want to build a scan that has these parameters time,how many consecutive bars,positive to negative negative to positive.
Marked as spam
Asked on November 20, 2017 1:20 pm
1064 views
|
|
Private answer
for instance i want the scan to show only when there has been a crossover (positive to negative or negative to positive) with 4 or more consecutive bars(as in 4 positive consecutive or 4 negative Depends on you preference on how many consecutive bars) too catch early cross overs. using MACD of course.How do i learn the script i would really like to learn i already have background programming knowledge. Marked as spam
Answered on November 21, 2017 12:55 pm
|
|||
|
Private answer
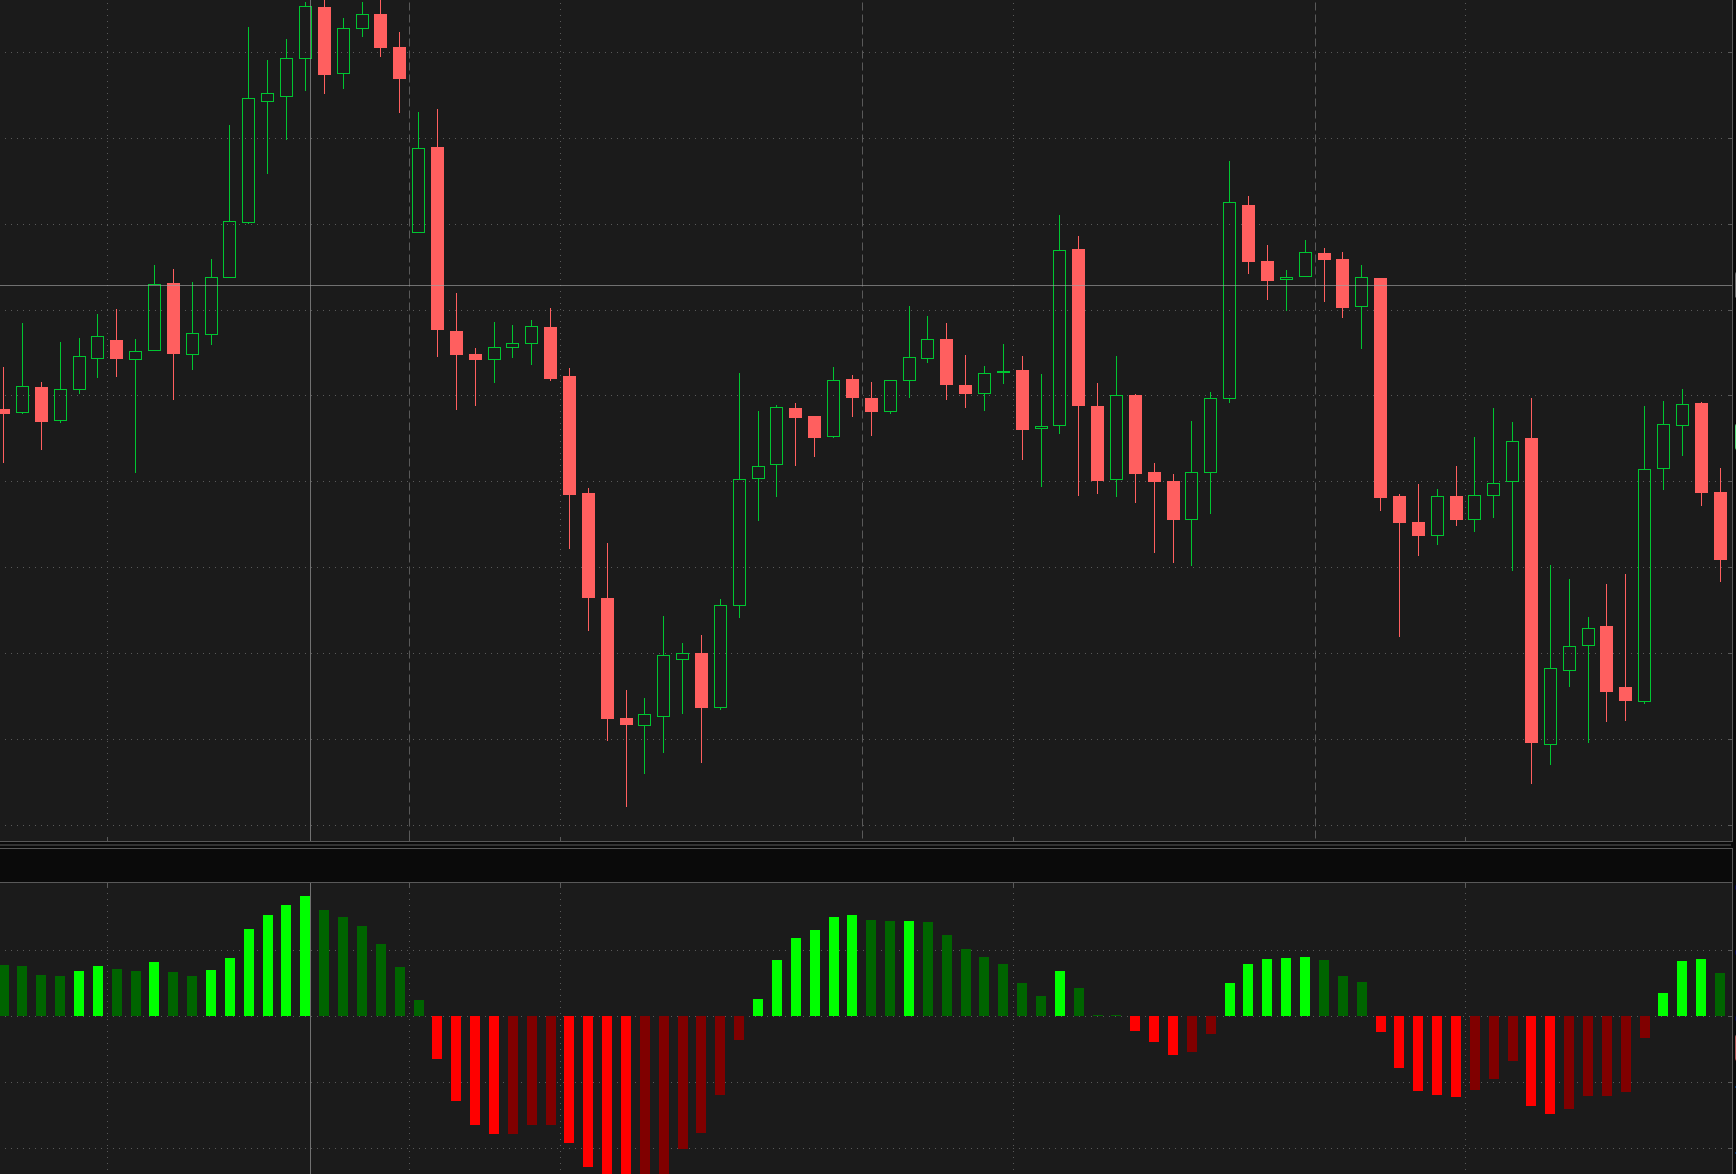
Here is an example. after running the scan this would be one that would show up With parameters negative to positive with 4 positive consecutive bars Attachments:
Marked as spam
Answered on November 21, 2017 2:43 pm
|
|||
|
Private answer
Ok, very good thing I persisted until we got this clarification. From your last response dated 11/21/17: So you want the rule to be “Find a MACD Histogram crossing above zero line, then alert once we get four consecutive positive bars AFTER that cross” I am going to take the code straight from Thinkorswim. The built in study named “MACDHistogramCrossover”. This does almost everything we need. You are requesting a scan so we don’t need to plot anything other than the signal. So we’ll strip out all the style statements and provide two options for the scan. One for cross below and one for cross above. Having completed those steps. All that is left is to shift the plot scan statement to look for a cross of the Histogram occurring 4 bars ago. Then check that we have been on the same side of the zero line since that cross occurred.
Marked as spam
Answered on November 21, 2017 3:57 pm
|
|||
|
Private answer
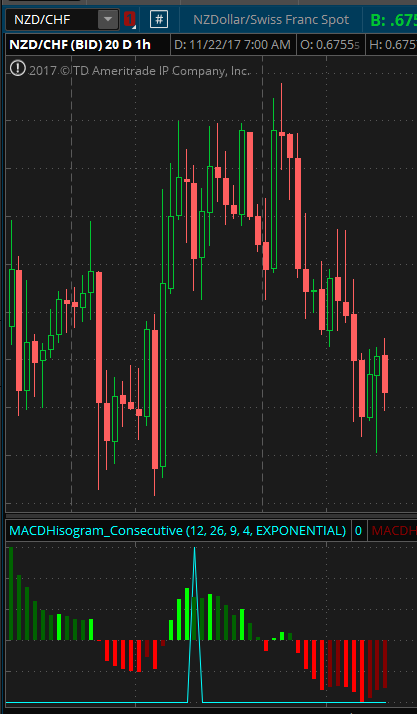
Yes this is exactly what i am talking about.But i need to know before it has four consecutive bars to keep an eye on.the scan would show only when it just had a cross over with 2 till four consecutive bars. for instance this showed up with the code you provided.It is very late to take the trade Attachments:
Marked as spam
Answered on November 22, 2017 6:46 am
|
|||
|
Private answer
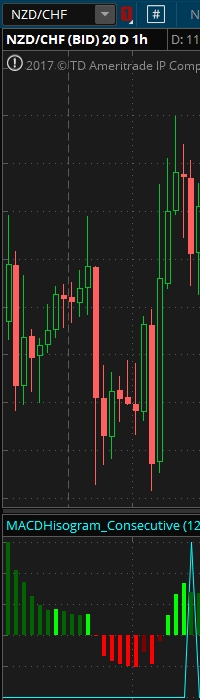
i need the scan to be like this. NZD/CHF just had a negative to positive crossover with 1 bar (The scan would pick it up) 2 consecutive bars (The scan would pick it up) 3 consecutive bars((The scan would pick it up) 4 consecutive bars((The scan would pick it up) and the same for a positive to negative
Sorry for not giving a good explanation Attachments:
Marked as spam
Answered on November 22, 2017 6:56 am
|
|||
|
Private answer
you my friend are a genius.One more thing it exceeds 4 consecutive bars how would i remove it from the scan. Marked as spam
Answered on November 22, 2017 9:00 am
|
|||
|
Private answer
the results do show more than four consecutive bars Marked as spam
Answered on November 27, 2017 8:26 am
|
Time parameter, already built into the scan engine. Positive to negative cross of the zero line and vise versa, already been done (it’s littered throughout the website). Not to mention you can already do this using standard tools of Thinkorswim that require not code whatsoever. You will need to explain how you want to scan for “consecutive bars”. Consecutive bars of what? How may consecutive bars (of what) do you want to scan for?