Plot only current SMA (Day) extending line (Month)


Category:
0
0

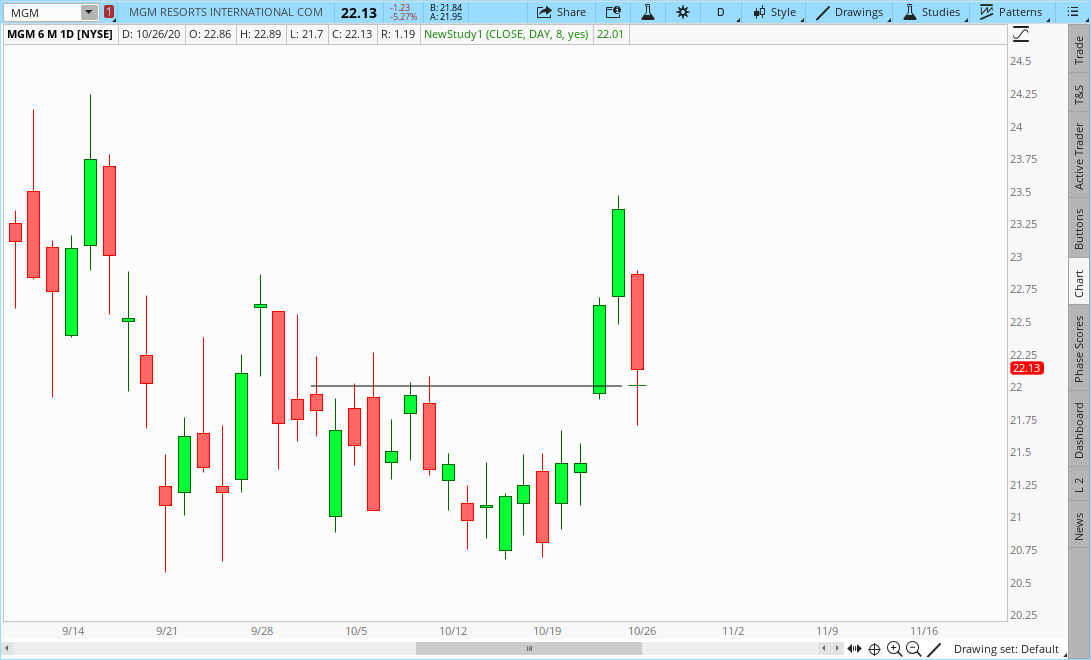
Hello Hahn! I wanted to make an indicator similar to the dailySMA wherein only the current bar’s SMA (close aggregationperiod = day) will have a horizontal line extending throughout the month (line aggregationperiod = month). I can only show the current bar’s horizontal line for its respective aggregation period and I wanted it to extend longer throughout the month. See pic below.

Attachments:
Marked as spam
Posted by (Questions: 5, Answers: 6)
Asked on October 26, 2020 9:49 pm
46 views
1
Private answer

So you want to compute the daily simple moving average on an intraday chart and then you want to grab the value of that moving average from the very last bar on the chart and project that line to the left. Then you would like that left-hand extension to continue only through the beginning of the current month. If I understand that correctly the following is your solution:

input timeFrame = AggregationPeriod.DAY;
input displayOnlyCurrentMonth = yes;
input maLengthOne = 21;
input maTypeOne = AverageType.SIMPLE;
def maOne = MovingAverage(maTypeOne, close(period = timeFrame), maLengthOne);
def lastBar = !IsNaN(close(period = timeFrame)) and IsNaN(close(period = timeFrame)[-1]);
def currentValue = HighestAll(if lastBar then maOne else 0);
def currentMonth = GetMonth() == GetLastMonth();
plot value = if displayOnlyCurrentMonth then if currentMonth then currentValue else Double.NaN else currentValue;

Marked as spam
Posted by (Questions: 37, Answers: 4086)
Answered on October 27, 2020 8:49 am
0
Thank you Hahn! It worked perfectly. If you have free time, I would like to ask what does these rows imply since I do not understand how it worked. def lastBar = !IsNaN(close(period = timeFrame)) and IsNaN(close(period = timeFrame)[-1]); def currentValue = HighestAll(if lastBar then maOne else 0); def currentMonth = GetMonth() == GetLastMonth(); plot value = if displayOnlyCurrentMonth then if currentMonth then currentValue else Double.NaN else currentValue;
( at October 28, 2020 6:23 am)
0
Took me over a decade to be able to write that and for someone new to writing code there is no way I can explain all of that in a brief comment. Might take a couple of hours to explain in a one-on-one consultation. Perhaps more. Depends on how well you are able to embrace new concepts and dimensions. The variable names pretty much explain what each line is doing. "lastBar" is the last bar on the chart. "currentValue" is the value of the moving average on "the lastBar". "currentMonth" is how the code knows where to plot the line.
( at October 28, 2020 8:51 am)