Scan TTM Squeeze for number of green dots after number of red


Category:
0
0
Hi Pete,

I looked into the following post for 'TTM Squeeze scan that looks the number of red dots in a row.'

<a href="https://www.hahn-tech.com/ans/ttm-squeeze-scan-that-looks-the-number-of-red-dots-in-a-row/">https://www.hahn-tech.com/ans/ttm-squeeze-scan-that-looks-the-number-of-red-dots-in-a-row/.</a>
It works great.

Can this scan be modified to include range of green dots after x number of consecutive red dots?.

Thanks,
Jay
Marked as spam
Posted by (Questions: 6, Answers: 7)
Asked on June 8, 2020 8:20 am
571 views
0
Private answer

I updated the title of your question  so that is describes exactly what you have requested. The previous title was too vague and could easily be confused with that previous post. This will also make it easier for the rest of our viewers to find this using the search function on the site.

Here is the code from that previous post, modified to generate the scan signal you requested. There are two user inputs in the first to lines. Adjusting those will set the minimum number of consecutive red dots immediately followed by the maximum number of green dots.

input numberOfRedDots = 3;
input numberOfGreenDots = 3;
input price = CLOSE;
input length = 20;
input nK = 1.5;
input nBB = 2.0;
input alertLine = 1.0;
def squeezeDots = TTM_Squeeze(price, length, nK, nBB, alertLine).SqueezeAlert;
def alertCountGreen = if squeezeDots[1] == 0 and squeezeDots == 1 then 1 else if squeezeDots == 1 then alertCountGreen[1] + 1 else 0;
def alertCountRed = if squeezeDots[1] == 1 and squeezeDots == 0 then 1 else if squeezeDots == 0 then alertCountRed[1] + 1 else 0;
def consecutiveRedDots = alertCountRed >= numberOfRedDots;
def firstGreenAfterRed = alertCountGreen == 1 and consecutiveRedDots[1];
plot scan = alertCountGreen == numberOfGreenDots and consecutiveRedDots[numberOfRedDots];

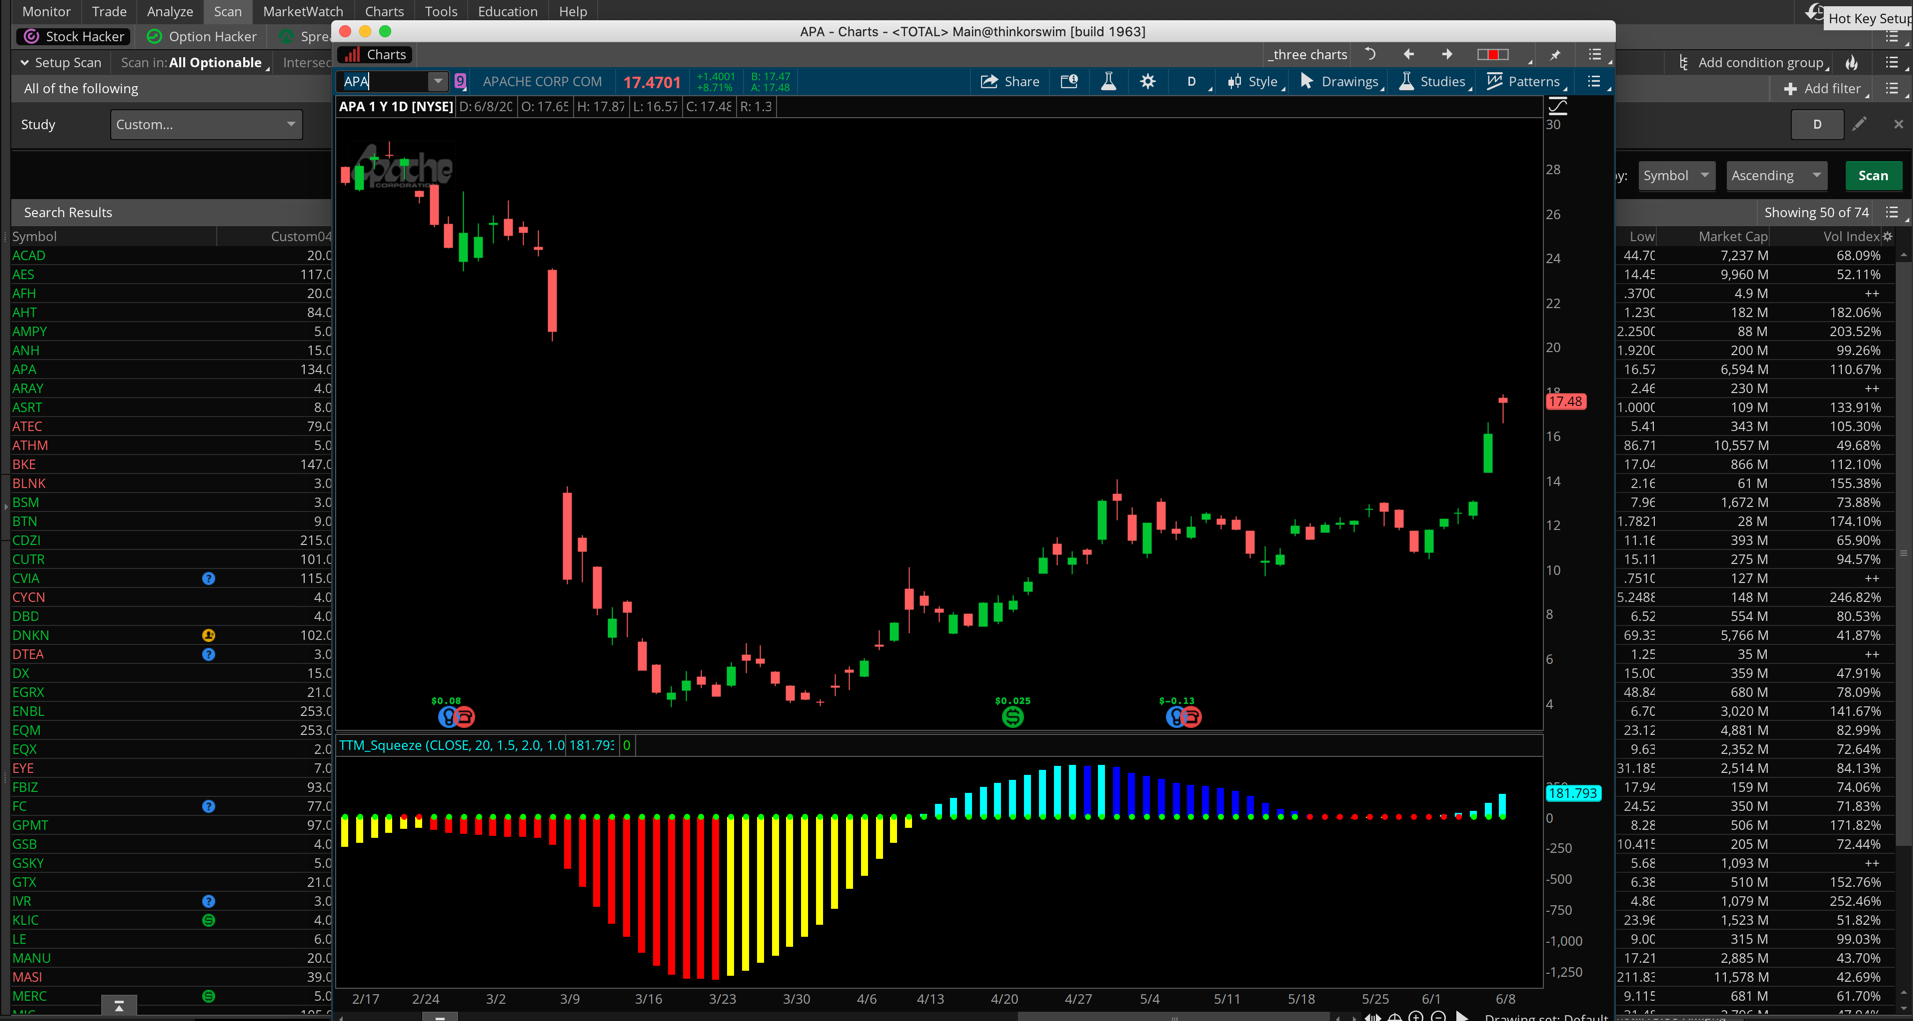
Screenshot below shows the results.

Attachments:
Marked as spam
Posted by (Questions: 37, Answers: 4084)
Answered on June 8, 2020 10:34 am
0
Much appreciated Pete. I checked with a Day timeframe and the results are accurate. For lower time frames, the results are not consistent. Is there something in the input section to make sure the scan works with the selected aggregation period?. PS: I was not able to elaborate the title as it had a character restriction I guess. Thanks Jay
( at June 8, 2020 10:45 am)
0
For all intraday charts you must set the "Start aggregation at market open" to unchecked. This setting is only available on charts and turning this on causes your charts not to match any of the other tools on the platform, such as scans, watchlist columns, study alerts, conditional orders.... everything. Worse yet, Thinkorswim developers in their infinite wisdom force all new charts to have this setting turned on by default. And as if that wasn't bad enough they refuse to even acknowledge this creates the problem I just described.
( at June 8, 2020 1:26 pm)
0
Thanks Pete, seems to work now. Its amazing how much time you spend on responding to all questions and comments, really commendable.
( at June 9, 2020 1:02 am)
0
Hi Pete, I didn't get any results when I changed the green dots to 1. I'm looking or the first green dot after a minimum of 3 red. Thanks!
( at June 20, 2020 12:45 pm)
0
Thanks for the heads-up on that. I have corrected the code in my answer to make that work as expected now.
( at June 20, 2020 1:53 pm)
0
You're the best as always! I'll take you out for dinner if I'm ever in Denver, I think that's where you're in?
( at June 20, 2020 2:20 pm)
0
Phoenix Metro Area, Arizona.
( at June 20, 2020 5:34 pm)
0
How would you write a custom column showing the number of previous red dots before this first green? Thanks again!
( at June 23, 2020 8:29 am)
0
Number of red dots is covered here: https://www.hahn-tech.com/ans/ttm-squeeze-watchlist-for-number-of-red-dots/ It does not include any details about first green dot. You should think this through before going any further with this idea. "Display number of consecutive red dots before the first green". That will be a static number that will persist until the next red dot appears at which point the value returns to zero until the first green dot? Sounds pretty confusing to me. And 10 or so green dots later you are still displaying the number of red dots before the first green dot which was 10 or more bars ago?
( at June 23, 2020 9:17 am)
0
I would only use the column for this scan. My thinking was the longer it has been in the squeeze, the better the chance the move up will be longer. I guess I can change the number of red dots criteria. Thanks for the advice Pete!
( at June 23, 2020 9:35 am)