| ♥ 0 |
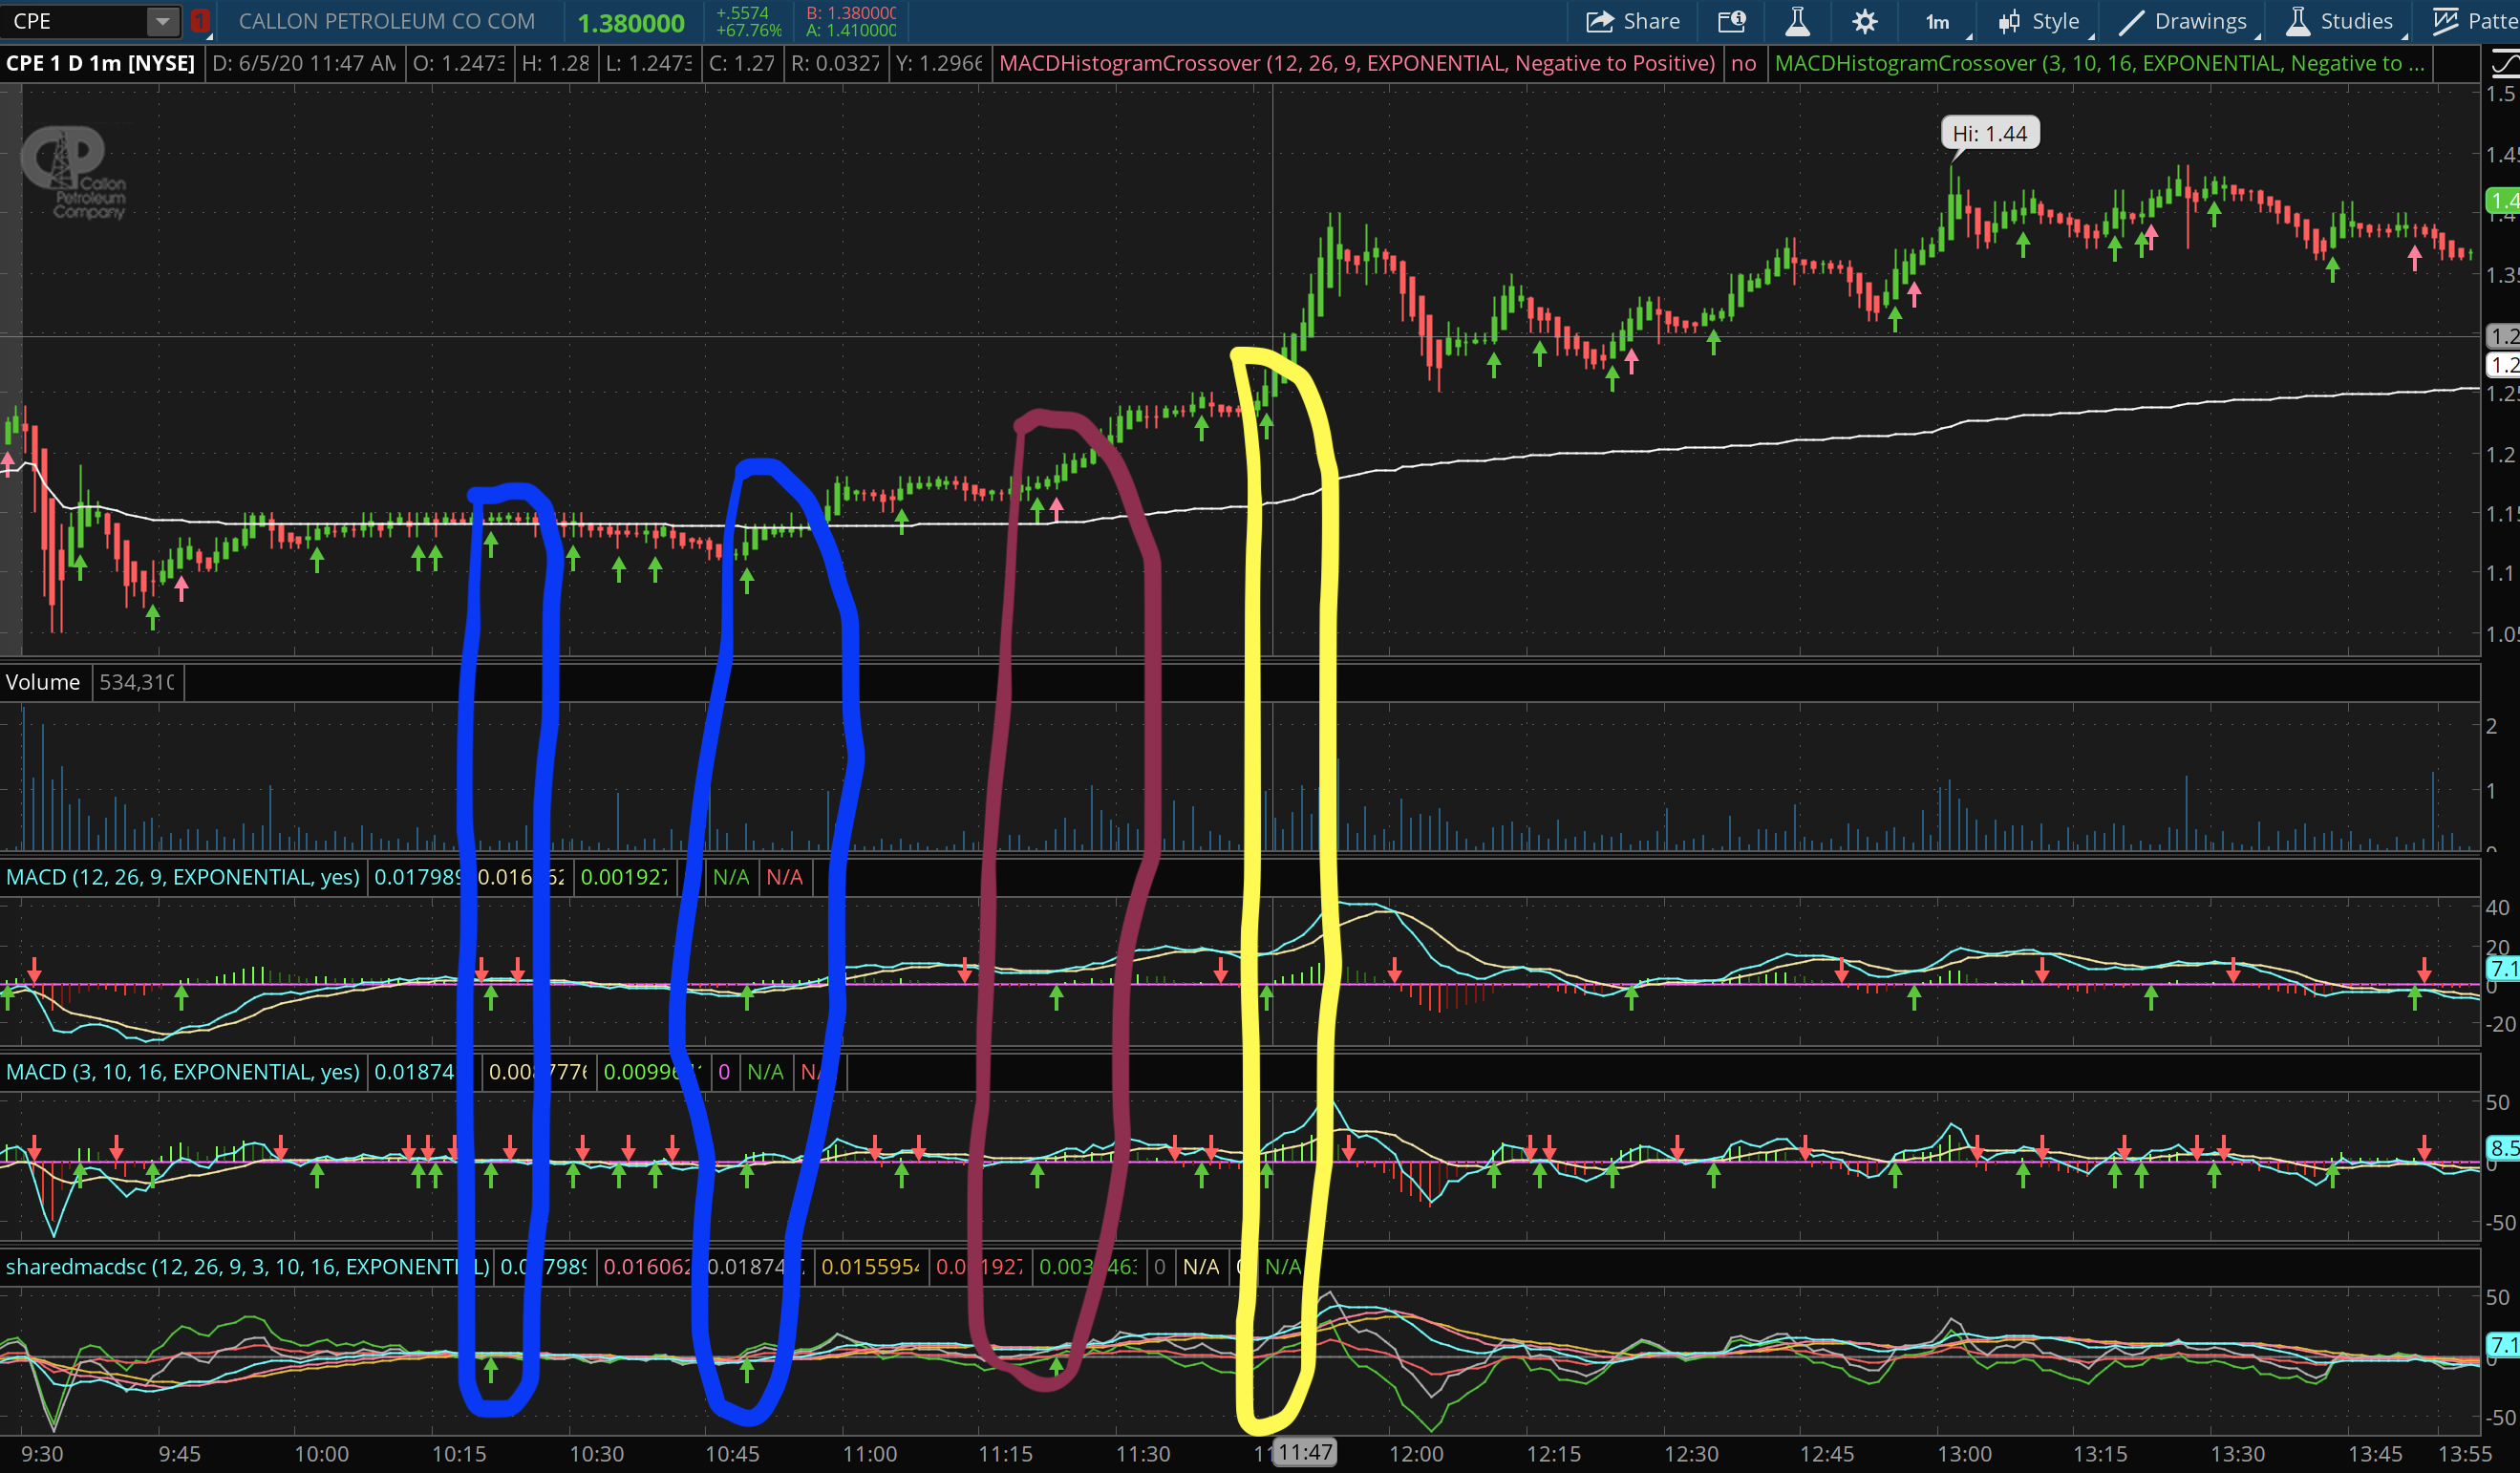
Can you create a study with an arrow and a scanner that uses the MACD histogram crossover with the settings 12,26,9 and also 3,10,16 on Thinkorswim. I attempted to create ny own chart study but some arrows are missing. Thank You. So basically two macd into one macd.
Attachments:
Marked as spam
Asked on June 8, 2020 7:33 am
211 views
|
|
Private answer
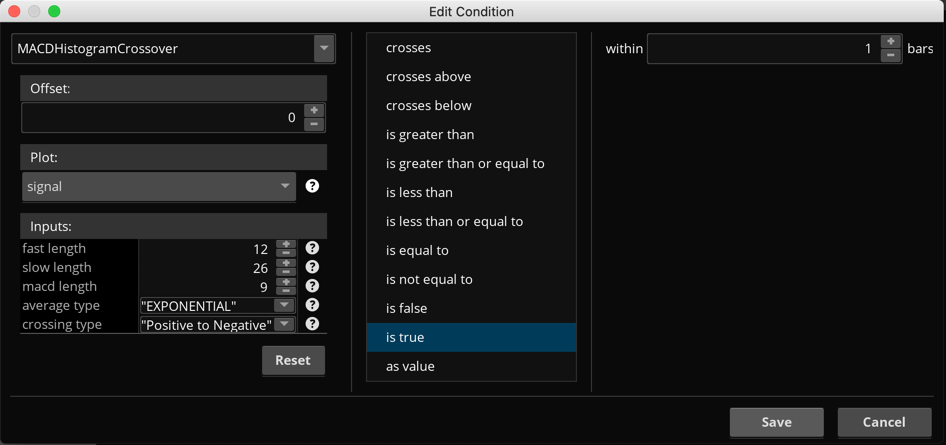
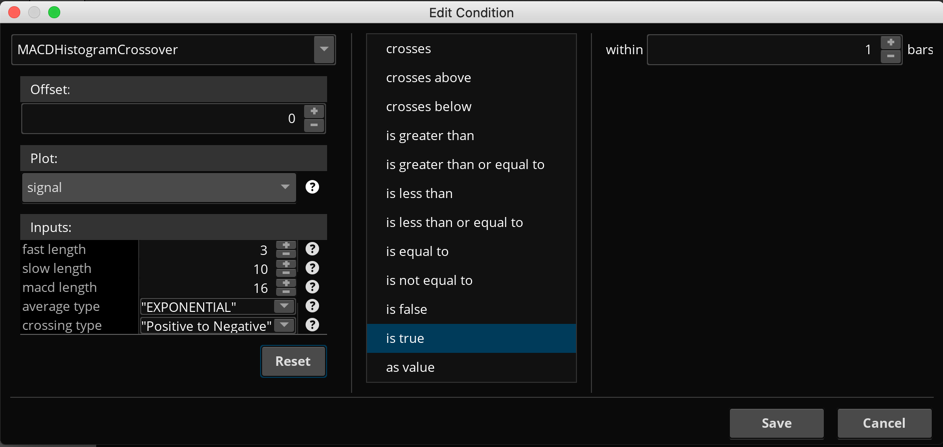
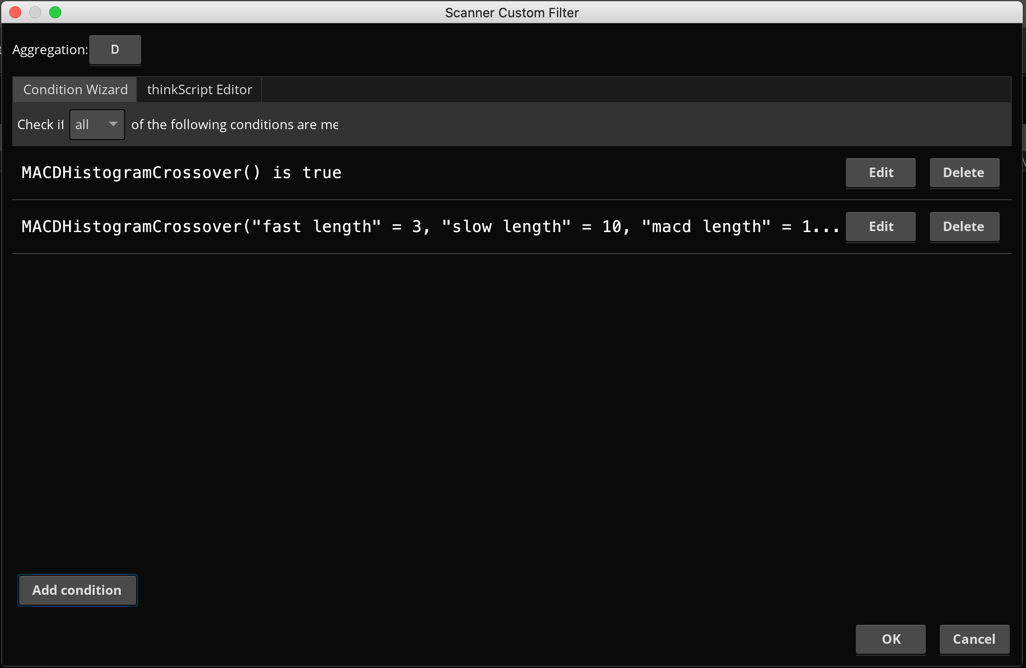
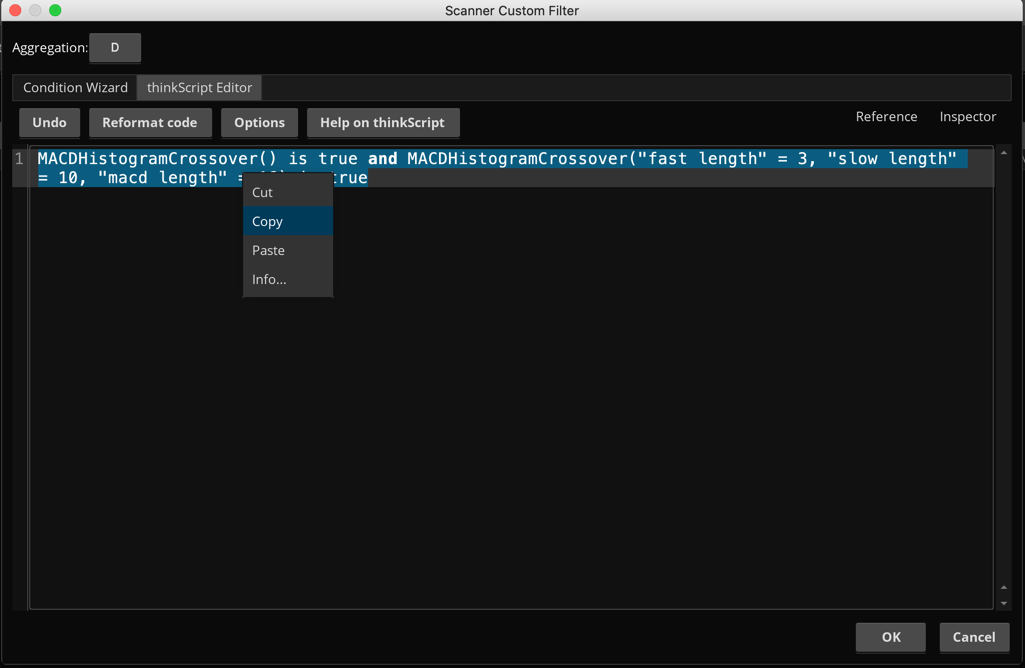
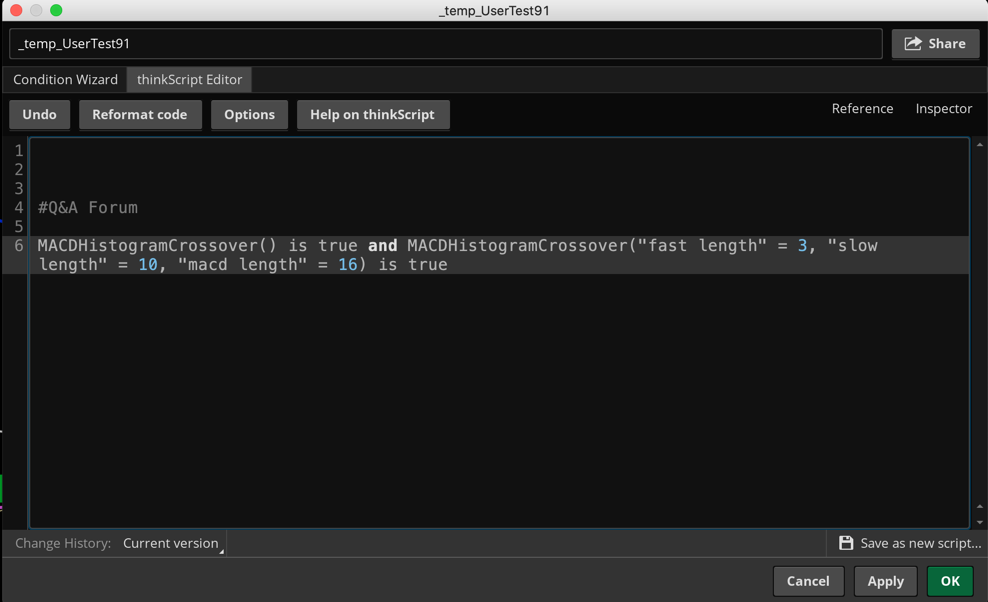
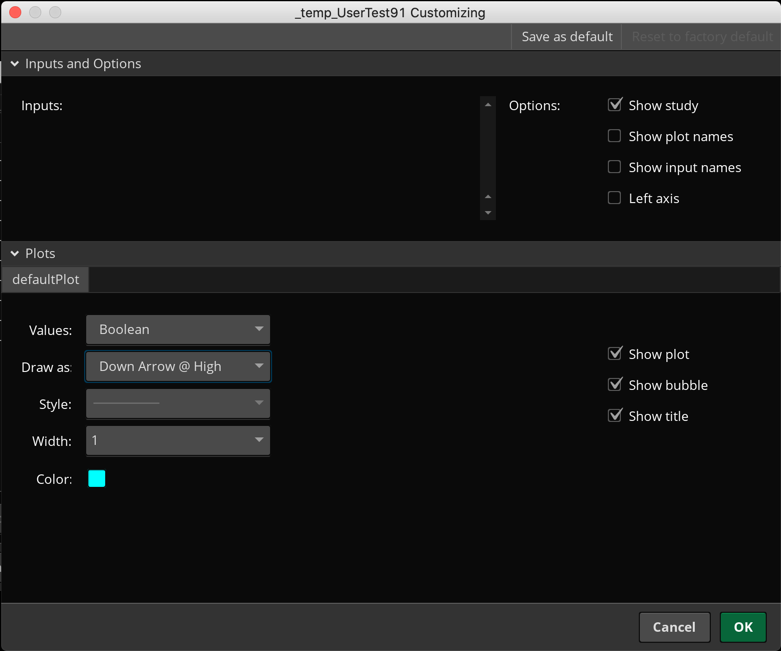
I updated the title of your question to make it easier for the rest of our viewers to find this using the search function. I also moved this into the "Stock Scanners" topic because we can build that and you can use the signals to build your chart study. We can build this without having to know how to write any code. Using the Condition Wizard you can build this in just several clicks of the mouse. The code it produces can then be copy/pasted into a new chart study, where you can adjust the plot style to Boolean Arrows. Again, no knowledge of code is required for any of this. Screenshots below show the basic steps. But before attempting this you should view our two free tutorials that cover the Condition Wizard on Thinkorswim: https://www.hahn-tech.com/thinkorswim-condition-wizard/ https://www.hahn-tech.com/thinkorswim-condition-wizard-watchlist/
Attachments:
Marked as spam
Answered on June 8, 2020 10:14 am
|