| ♥ 0 |
i really dont know anything about how to create a scanner.If anybody could help me find how to find these certain patterns. I would be really grateful.Thank you very much. Attachments:
Marked as spam
Asked on June 6, 2018 5:54 am
1614 views
|
|
Private answer
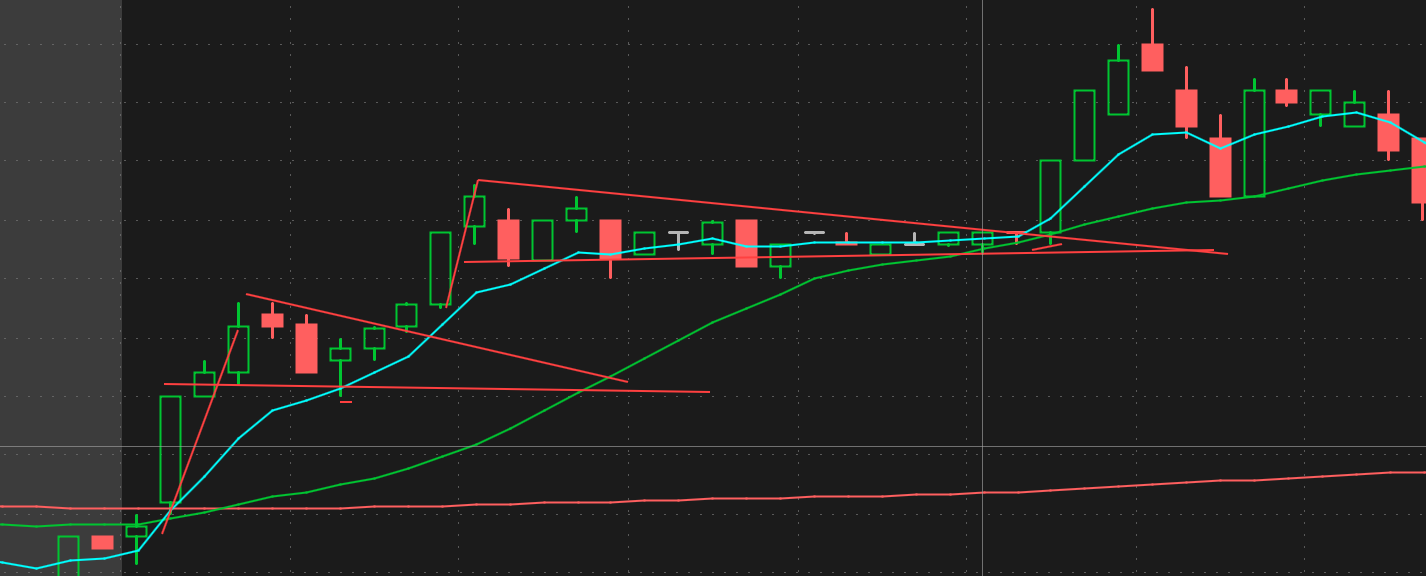
The title and url of this question has been updated to remove two typos and provide a clearer description of the context. Price patterns are extremely complex. Most people fail to realize how much variance is included in the patterns their eyesight identifies on a chart. I suggest you give up on this quest because based on your lack of detail, you are not even close to being able to provide the specifications required to get it done. There is no way to write code to find pullbacks based on a couple of examples from a screenshot. An incomplete screenshot no less. Where is the rest of the chart??? I see no ticker symbol, no time frame, and no date reference. I have no way of bringing up this chart on my platform to identify those two patterns you marked with trendlines! From the perspective of computer code, the two separate patterns in your example are so completely different it is impossible to know y0ur specifications. We don’t do magic here. You need to bring crystal clear specifications. Is it a pullback to a moving average? You need to describe this in mathematical and logic based terms. Here is an example of a pullback we coded for another post: https://www.hahn-tech.com/ans/price-pullbacks-to-30week-moving-average-with-cci-100/
Marked as spam
Answered on June 6, 2018 7:38 am
|