Tick Charts Volume


Category:
0
0

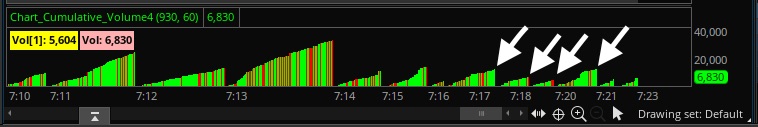
Hello Pete,

I am playing with Tick charts Volume acumulation within a minute. I got the actual cumulative volume and last minute cumulative volume coded already however I am struggling when getting Vol[2], Vol[3], etc How can I do it?. I also would like to get VAvg within minute time. I know I can get this values in a minute chart but I’d really like to see it on a tick chart.  Thanks in advanc

declare lower;

input aggregationInSeconds = 60;

def start = 0000;
def end = 1600;

def min_elapsed = Floor(SecondsFromTime(start) / aggregationInSeconds);
def min_togo = SecondsTillTime(end) / aggregationInSeconds;
def check = min_elapsed != min_elapsed[1];

def CumulativeVol = if check and !check[1]
then volume
else if !check
then CumulativeVol[1] + volume
else CumulativeVol[1];

def prevcumulativehigh = if check and !check[1]
then CumulativeVol[1]
else prevcumulativehigh[1];

AddLabel(yes, Concat(“Vol[1]: “,prevcumulativehigh), Color.YELLOW);
AddLabel(yes, Concat(“Vol: “,CumulativeVol), Color.PINK);


Attachments:
Marked as spam
Posted by (Questions: 1, Answers: 1)
Asked on February 16, 2021 9:07 am
128 views
0
Private answer

I am guessing the only reason you are trying to get "Vol[2], Vol[3], etc " is so you can compute the 1 min average volume? Thinkorswim does not provide for custom sized arrays. Which would be the essential language element needed to compute a moving average from the data you have so far computed.

If there is a way to solve this using the limited tools available in Thinkorswim the task is way beyond the brief 15 min I allocate for each free solution I provide in the Q&A Forum.

Marked as spam
Posted by (Questions: 37, Answers: 4091)
Answered on February 16, 2021 9:54 am