| ♥ 0 |
Pete, can you help me update the code from the TTM Squeeze alert you created (https://www.youtube.com/watch?v=GTyq_hLM_mc&t=1s). I want the alert to only trigger when the TTM Squeeze dot is green? Currently I’m using the following thinkscript for a chart alert when the the Squeeze goes above the zero line [TTM_Squeeze_Alert() is equal to 1]. That thinkscript should remain the same. The adjustment I’m looking for is to the thinkscript of the indicator to allow for the statement to be true ONLY when the Squeeze dot is green. Is there a way to adjust that?
Marked as spam
Asked on October 30, 2020 3:31 pm
903 views
|
|
Private answer
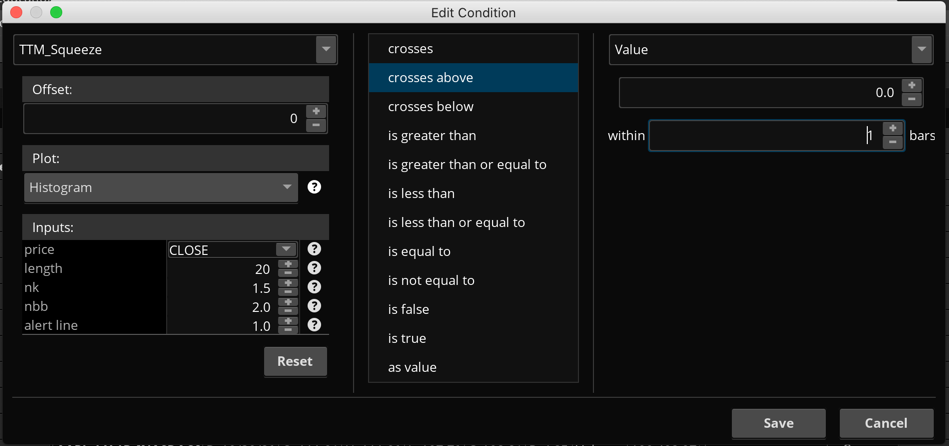
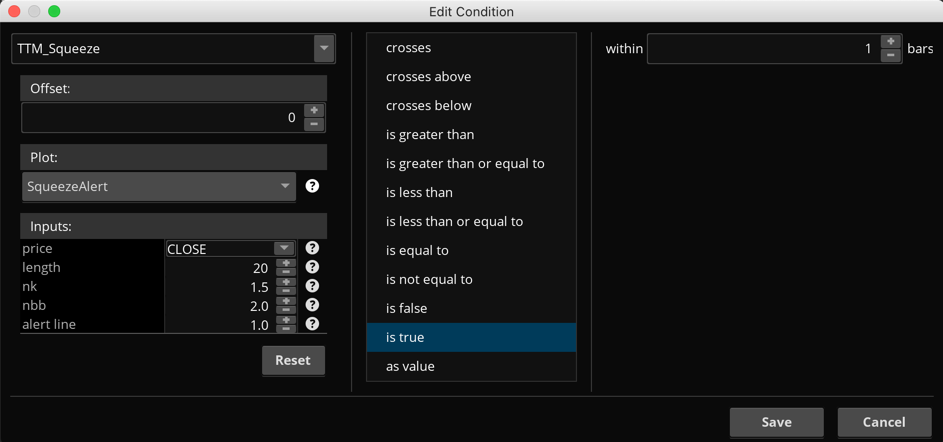
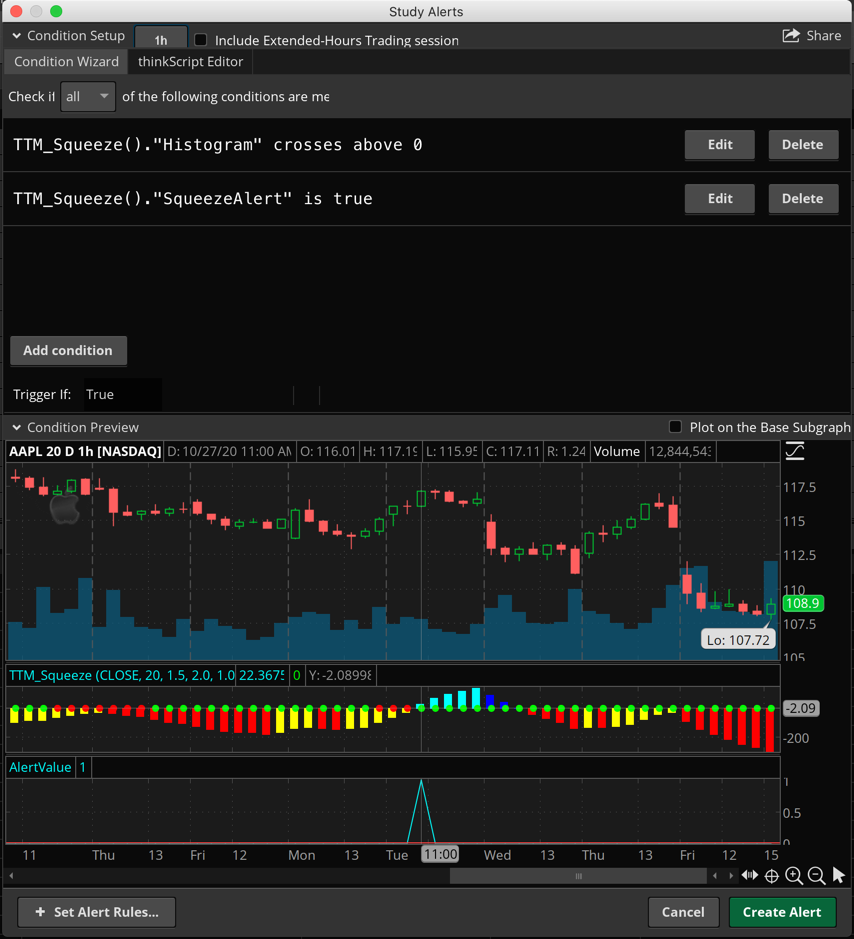
That video you linked was for a custom scan based on the histogram of the TTM_Squeeze. But it can certainly be used for a Study Alert. I just wanted to clarify that for the benefit of the rest of our viewers and make sure they are not confused. As I understand your request. You would like the code to find stocks where the histogram of the TTM_Squeeze is crossing above the zero while at the same time the dot on the center-line is green. The solution does not require any custom code at all. Anyone that can use a mouse or trackpad can build this scan using the Condition Wizard. Screenshots below shows how to set this up in the Study Alert. The same exact method can be used in the Study Filter of a scan. So you can apply this solution to either tool in Thinkorswim. The following video demonstrates how to use the Condition Wizard to construct many types of custom scans: https://www.hahn-tech.com/thinkorswim-condition-wizard/ Once you learn how to use that tool you wont have much need for any of my assistance. Attachments:
Marked as spam
Answered on October 30, 2020 4:14 pm
|
|||
|
Private answer
So you want a chart study. Not an alert? If that is the case this question should have been posted in the "Chart Studies" topic and not the "Alerts and Notifications" topic. Context is everything. If you do not want a "chart alert" but you do want a chart study then what exactly do you mean by "...triggering a signal..." It seems that you are looking for a custom version of the TTM_Squeeze. Complete with the histogram and green and red dots that plots on a lower study. If that is the case then you need to post this as a new question in the "Chart Studies" topic. Then clearly state exactly what you mean by "...triggering a signal...". If that is not an alert, the only thing left is an arrow that plots when the conditions are met. Marked as spam
Answered on October 31, 2020 3:58 pm
|