| ♥ 0 |
Hi, I am VERY new to thinkscript and this is my first attempt. I watched a few of your videos but cannot get this to work. I am trying to add it as a column in a scan/watchlist. It does display correctly on a chart but gives an error in a watchlist, it says it is too complex? ——————————————————————– def MyBuy = TTM_ScalperAlert().”PivotLow” == yes;
plot TTMValue = if MyBuy == 1 then 1 else if MySell == 1 then -1 else 0; AddLabel(TTMValue == 1, “Buy”, color.LIME); Would you be so kind to give me some guidance please?
Marked as spam
Asked on August 7, 2021 11:51 am
723 views
|
|
Private answer
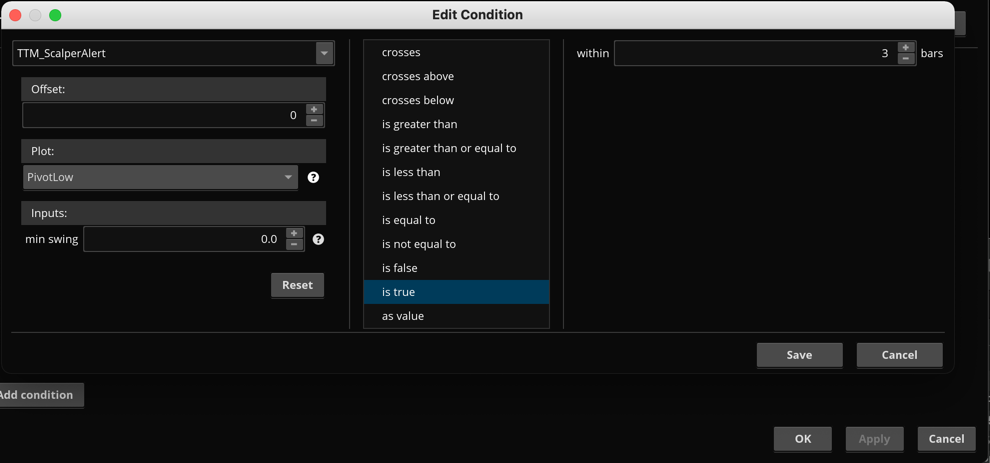
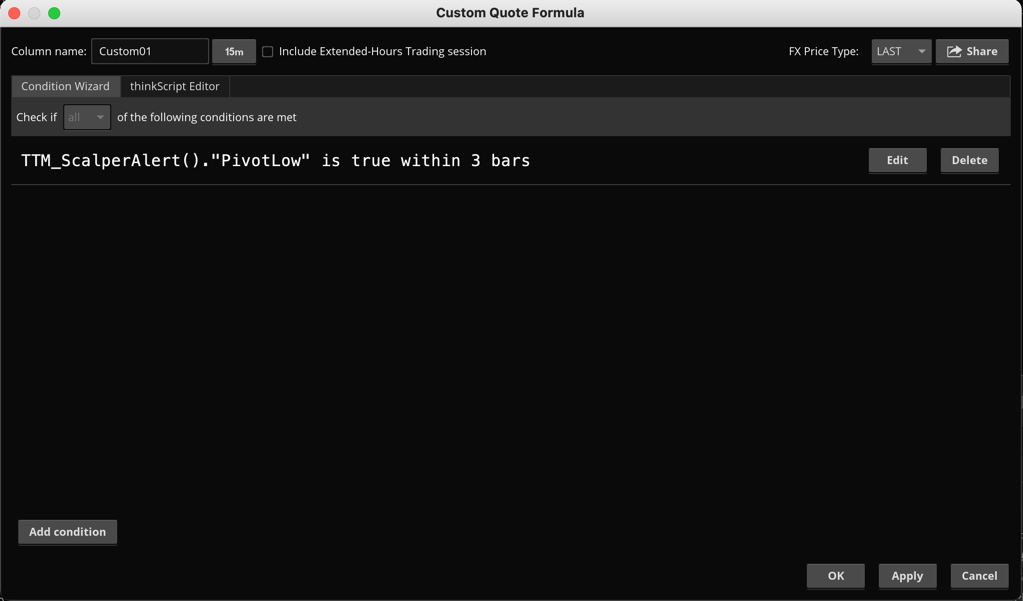
When I first tested this I was led to believe this was impossible. Something within the code is not supported in a custom watchlist column. But I looked at it again with a fresh set of eyes this morning and discovered a way to get very limited functionality from this, but at least it's better than nothing. The solution I found was to use the Condition Wizard. This is the best way to test things out when you can't get the custom code to work. If you haven't learned how to use the Condition Wizard yet you are really missing out on a very useful tool. Here is the link to our video on the Condition Wizard: https://www.hahn-tech.com/thinkorswim-condition-wizard/ And we have another video on the Condition Wizard that specifically covers custom watchlist columns: https://www.hahn-tech.com/thinkorswim-condition-wizard-watchlist/ I have included some screenshots below that show the basic steps for how to set this up for the TTM_ScalperAlert study on Thinkorswim. Please note the "within bars" parameter must be set to a value of 3 or greater. These signals reference futures bars so you will never find an alert trigger on the last bar of the chart. These are always going to show up on the chart 2-3 bars back from the current bar on the chart. Zero is displayed when no signal is found. Here is the code generated by the Condition Wizard exactly as it appears in the screenshots below. The example below displays a 1 in the watchlist column if a PivotLow is found within the last three bars of the chart:
We can improve on this by changing the color of the value that is displayed. Green if the value is 1 and current color if value is 0:
After this, I was able to get it to work as a label to display text and set the color of the text based on the value. When a value of 1 is found it displays the text "ScalpLow" (in green) and when the value is zero the column displays the word "Flat" (in current color):
I tested this out using the AssignBackGroundColor() function and it fails. Apparently that type of style is not supported for the TTM_ScalperAlert applied to a custom column. Also note that if you try to add the other signal "PivotHigh" the code will fail. Apparently this is very fragile and I have discovered the only methods to get any of this to work. If you need to have both signals in your watchlist you can simply add two custom columns and set one to display the PivotLow and the other to display the PivotHigh. Combining them into a single custom column is not supported in the current version of Thinkorswim. Attachments:
Marked as spam
Answered on August 8, 2021 8:59 am
|