

Thinkorswim Tutorials

Blue Left Arrow

Sub Topics in this Category:

  • TOS Charting
  • TOS Scans
  • TOS Strategies
  • TOS Watchlists

This is the top level category for Thinkorswim tutorials. You are encouraged to use the left side-menu to navigate among topics that interest you. (view as desktop for best experience) The left side-menu will help you keep track of where you are, and which content you have already viewed.

Want some help navigating the site? You may want to view our short Introductory Video.

Looking for something specific? Use the search box at the bottom of the left-side navigation menu.

Need help with a solution not yet covered? In addition to tutorials we also provide a Q&A Forum. First of all, be sure to search our Q&A Forum for additional resources. You also have the option to post a new question

Listed below you will find all the videos and articles included in the Thinkorswim category.


Thinkorswim Strategy Guide MTF 35

After a brief slide show explaining the differences, you will see how to use the MTF MACD Strategy to extract theoretical trades from Thinkorswim into a spreadsheet for analysis. Thinkorswim Strategy Guide MTF is a more advanced version of previous videos published on this topic.

Thinkorswim Strategy Guide MTF

Thinkorswim Options Trading Tutorial

Thinkorswim Options Trading Tutorial 9

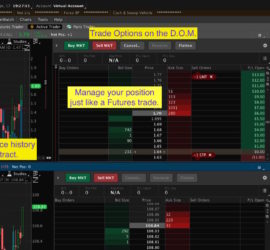
Did you know that you can trade options contracts on the D.O.M. just like futures contracts? If not, then this video is about to blow your mind. Did you know you can display the trade history of an individual option contract in a chart, just like Socks, Futures and Forex? This video shows you how to enter and manage a trade for individual options contracts using the D.O.M. (Depth Of Market).


Thinkorswim Watchlist TTM Squeeze 86

This indicator compliments a previous video we published that displays the colors of the TTM Squeeze histogram in a watchlist. Use these together to create a ‘radar screen’ similar to those used in TradeStation. In a single glance you can see stocks that are ready to make a move and which direction the indicator is predicting.

Thinkorswim Watchlist TTM Squeeze

Thinkorswim Strategy Ichimoku

Thinkorswim Strategy Ichimoku 30

See exactly how the Ichimoku indicator performs across bear and bull markets. This Thinkorswim custom strategy plots the profit and loss graph for several Ichimoku based setups. Cloud breakouts, or cloud breakdowns, trend continuation, with and without confirming signals. It’s all covered in one package. Track long and short strategies on the same chart. Exits are handled via an adjustable Parabolic SAR.


Thinkorswim Alert High Low 30

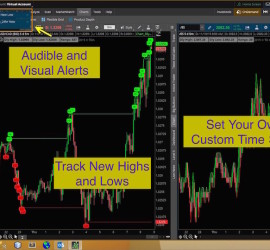
Displays both the new highs and new lows over a time span you specify. Alerts, both audible and visual, are triggered at each new high and low throughout the time span you specify. The range in ticks (pips) from high to low is displayed in a chart label along with the high and low.

Thinkorswim Alert High Low