Creating a Custom Scan Using TTM Squeeze Histogram
Thinkorswim Scan TTM Squeeze Histogram
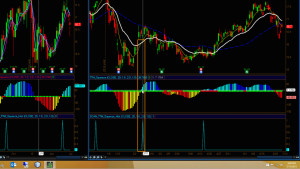
Learn how to build custom stock scans and spend less time reviewing charts. This video shows that you don’t need access to the source code to write a customized scan for a licensed indicator on the Thinkorswim platform. In this video, Thinkorswim Scan TTM Squeeze Histogram, you will learn how to build and run a custom scan. You will receive a free custom scan indicator via clicking the link below. This indicator is actually four different scans built into one. This video shows how to select which of the four scans to run.
Lean More:
Would you like to learn how to master the custom scan tools on Thinkorswim?
Click here: Thinkorswim Scans Beginner to Advanced
Learn how to build custom scans without writing any code: Thinkorswim Condition Wizard
*The TTM Squeeze is a proprietary indicator owned by Trade The Markets. It is available free to all TD Ameritrade clients who have access to the Thinkorswim platform.
DISCLAIMER: I AM NOT A CERTIFIED FINANCIAL ADVISOR AND NOTHING IN THIS VIDEO OR TEXT IS AN ADVERTISEMENT OR RECOMMENDATION TO BUY OR SELL ANY FINANCIAL INSTRUMENT. NOR IS THIS VIDEO OR TEXT INTENDED TO INSTRUCT YOU ON HOW TO MAKE BUY OR SELL DECISIONS USING ANY OF THESE INDICATORS.
*Thinkorswim is a chart analysis platform offered by TD Ameritrade: www.tdameritrade.com
TD Ameritrade provides financial services including the trading of Stocks, Futures, Options and Forex.
Please be sure to share this page with your friends and colleagues. Leaving comments below is the best way to help make the content of this site even better.
I added the code to the scan and charts. I am trying to sort just by Low to high pivot but ts scans all names that have done it looking back so i get 4000 results. How do i scan so it just tells me if it changed in the current or very recent period?
disregard i figured it out
Glad to hear that. I was away from the computer and could not access the tools needed to provide assistance.
I dowloaded the code and added this in the Chart studies and also in the TOS Scan filter. But when I do the scan the squeeze histogram is not spiked up in the chart even when the Stock is showing up in the scanner.
Check that you have set the time frame exactly the same on both. If you are using intraday time frame check the chart setting named “Start Aggregation at market open” That needs to be turned off or your intraday charts will never match the rest of the tools on the platform.
Where do I find how to link a watchlist scan to a chart in TOS? My Chart is red but there seems to be no place to label RED the Scan.??
A scan is not a watchlist. So lets make sure we understand the terms. It is possible to link a watchlist but it is not possible to link the results section of a scan.
I copy/pasted the “Strat_PivotRev_TrailSqz” script directly from the website onto ThinkScript Editor and made sure any previous lines were deleted, still no error codes and still “ok” button is disabled.
Sorry but I can’t help you here. I just tested it and it’s works fine. I suggest you post this in the Q&A forum and include a screenshot showing what your scan look like. Perhaps we can see something you missed.
Thank you for the educational videos. I have a question: after I try to create a custom scan in ThinkScript Editor, the “OK” button remains grey and won’t let me save it, I have tried many times, there are no error codes in the script, the “OK” button is still grey and I cannot save it, could you help please ? Thank you.
There are only two scenarios in which the OK button is disabled One is when the code generates an error. Second would be if the code editor was empty. If you have code in the editor and the OK button is disabled but still don’t see an error there must be something blocking you from seeing it.
Been working with your TTM Squeeze just recently and trying to change the scan to alert me when the red or yellow bars are below a given level so that I can check the stock out and perhaps put it on another watch list to watch closer. Another option may be two have two consecutive yellow bars as the 2nd is the confirmation bar. Those would be ideal options. Can this be done?
Tons of examples listed in the Q&A forum. Just use the search box at the top of the page to find what you are seeking. The following link shows the search results for “TTM Squeeze” on all categories in the forum: https://www.hahn-tech.com/ans/?question_type=all&category=&search=TTM%20Squeeze
TTM_Squeeze histogram
When I copy/pasted your script, it produced three errors. (I’m on a macOS 10.16.3)
Invalid statement: plot at 9:1
Invalid statement: assignBackgroundC… at 13:1
Invalid statement: hist at 17:1
Any suggestions?
My buddy is on Windows and he has it running. Is there a difference in the macOS and WindowsOS library that might cause these errors?
Thanks
Did you try the link I provided in my last reply?
Sorry…I must have missed your last reply. But, I did just find https://drive.google.com/file/d/0BwDtomDCJd6fNUlxeTM5YVNGa2c/view
Is this it?
Thanks for your reply Pete.
No, that is not the link I provided. Here it is again. Just import this directly and don’t bother trying to copy/paste: http://tos.mx/HYCVaUd
Also, don’t try pasting code in the comment section of a video The Q&A forum is the place to request more advanced assistance. But you will not need any more assistance because that link I included above will bypass the entire issue you are having.
Peter, thank you VERY much for your reply and the link. Understand not posting code in comment section of the video…if I can, I will delete it. BTW, the reason I had 17 lines is because I tried to match the script in your video…it had null lines and, therefore, had 17 lines. I put in the null lines and tried to match the video line for line.
Actually, now that we’re in a COVID-19 non-social status, we stayed in last night and I went through all of your tutorials and was successfully able to do each of your scripts. (I also found your post with the shared link in the other post thread…thanks)
Thinkorswim TTM Squeeze Watchlist
Thinkorswim Custom Watch List Columns
Thinkorswim Watchlist TTM Squeeze
Custom Watchlist Columns Colored to Match Dots on TTM Squeeze Centerline
I also was successful in creating three additional columns for daily, weekly and monthly (and, following your suggestion, named them D_Sqz, W_Sqz, M_Sqz)…I now have three columns with color. Which leads me to one more question: in Charts, we are able to customize a time frame but we don’t seem to have that option in watchlist time frames. Is that correct?
You have provided your followers with some excellent add on tools…thank you.
Thanks so much for taking the time to let us know what you did and how you got things working. Glad things are setup and working for you now. As for custom time frames, those are only supported on the charts. This is not available anywhere else on the platform, yet. Be sure to submit a feature request to TDA support if custom time frames across the platform are essential to your trading success. Thanks for the voluntary contribution too! Take care.
And to answer you question, I use Mac as well and when I test it works perfectly. There is nothing wrong relating to a “library”.
Im no good with coding but i have it setup so i can run the pivot high and the pivot low at the same time,pivot low spike colored green and pivot high red.