Creating a Custom Scan Using TTM Squeeze Histogram
Thinkorswim Scan TTM Squeeze Histogram
Learn how to build custom stock scans and spend less time reviewing charts. This video shows that you don’t need access to the source code to write a customized scan for a licensed indicator on the Thinkorswim platform. In this video, Thinkorswim Scan TTM Squeeze Histogram, you will learn how to build and run a custom scan. You will receive a free custom scan indicator via clicking the link below. This indicator is actually four different scans built into one. This video shows how to select which of the four scans to run.
Lean More:
Would you like to learn how to master the custom scan tools on Thinkorswim?
Click here: Thinkorswim Scans Beginner to Advanced
Learn how to build custom scans without writing any code: Thinkorswim Condition Wizard
*The TTM Squeeze is a proprietary indicator owned by Trade The Markets. It is available free to all TD Ameritrade clients who have access to the Thinkorswim platform.
DISCLAIMER: I AM NOT A CERTIFIED FINANCIAL ADVISOR AND NOTHING IN THIS VIDEO OR TEXT IS AN ADVERTISEMENT OR RECOMMENDATION TO BUY OR SELL ANY FINANCIAL INSTRUMENT. NOR IS THIS VIDEO OR TEXT INTENDED TO INSTRUCT YOU ON HOW TO MAKE BUY OR SELL DECISIONS USING ANY OF THESE INDICATORS.
*Thinkorswim is a chart analysis platform offered by Charles Schwab: https://www.schwab.com/
Charles Schwab provides financial services including the trading of Stocks, Futures, Options and Forex.
Please be sure to share this page with your friends and colleagues. Leaving comments below is the best way to help make the content of this site even better.
Pete the script is incomplete when I install it I get the histogram but none of the other features. Help
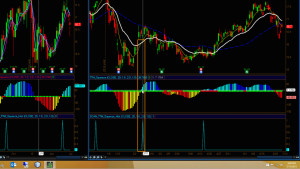
Well to be clear, the code provided is intended to be used as a scan. The only reason I added this to a chart is to demonstrate where the scan signals appear on the chart.
Hi Pete, great work!. When I click on the .ts file in the description I don’t have anything that will open it. It seems to be a video file. Am I clicking on the right link to get the code? Thanks,
The solution is found in our FAQ. The file cannot be opened for copy/paste. You must save it to your hard drive and import it. Details here: https://www.hahn-tech.com/ans/how-to-download-and-import-study-ts-files-into-thinkorswim/
Thanks Pete, I changed the file name extension and it opened in Word. Another question Pete. I’ve checked out John Carter’s video on the squeeze and he’s interested in the moment in time when the Bollinger bands expand outside of the Keltner Channels as a buy signal. This is indicated when red dots run into green dots. The histogram, based on the Momentum Oscillator, suggest direction. Is your intent with the zero line crossover to focus only on the change in momentum without the Bollinger Band compression? Thanks again!
The intention of the video was to show how to create a scan that is based on the histogram. Anything more than this is outside the context of this particular video. If you are looking for information about how to scan for the red and green dots on the center-line you will find those solutions posted in our Q&A Forum.
Hi Pete, first of all, I highly appreciate your support and the knowledge you’re sharing.
I copied your code above to new Strategy and tried to add an AddOrder to it to show the same spike position as an Entry signal on the chart but it didn’t work.
Here are below the lines that I added:
def EntrySignal = zeroLinePositiveFollowThrough;
AddOrder(OrderType.BUY_AUTO, EntrySignal, tickcolor = GetColor(2), arrowcolor = GetColor(4), name = “TTM_SQ EP”);
Thanks for your explanation and support.
Where is your exit order? Your attempt is very likely working. But without any sell orders the strategy will only plot the first buy order and hold. You have a buy and hold strategy here. Did you try turning on the P/L graph on the bottom to see the theoretical returns? If everything I just said sounds like gibberish then you need to get up to speed on this topic:
https://www.hahn-tech.com/thinkorswim-strategy-guide/
https://www.hahn-tech.com/thinkorswim-strategy-analysis/
https://www.hahn-tech.com/thinkorswim-scan-to-strategy/
https://www.hahn-tech.com/thinkorswim-autotrade-almost/
Hey Pete. First I want to congratulate you for the excellent job you are doing here. The content is excellent and extremely valuable. Thanks. I was wondering if you have available another video like this one ,with instructions of how to set up a scan and the study to go short on the stocks. I guess is a matter of changing the code description. If you can point me to the reight direction I will really appreciate it.
Thanks in advance
Tons of examples in the Q&A Forum. Here is a link to the search results I just did. Search term was “Squeeze histogram” in the Stock Scanners topic: https://www.hahn-tech.com/ans/cat/scans/?question_type=all&search=squeeze%20histogram
Anyone know how to update the code to only get an alert when the TTM Squeeze dot is green?
I think the answer to that question was already posted in our Q&A Forum: https://www.hahn-tech.com/ans/is-it-possible-to-have-an-alert-when-the-ttm-squeeze-indicator-changes-color/
Thanks Pete. Unfortunately, that doesn’t solve the problem. Currently I’m using the following thinkscript for a chart alert when the the Squeeze goes above the zero line [TTM_Squeeze_Alert() is equal to 1].
That thinkscript should remain the same. The adjustment I’m looking for is to the thinkscript of the indicator to allow for the statement to be true ONLY when the Squeeze dot is true. Is there a way to adjust that?
Sure thing. But no able to provide that level of assistance in the comments section of the video. That’s what the Q&A Forum is for. Thanks.
Correction: Squeeze dot is true SHOULD SAY Squeeze dot is green.
Ok. Thanks. I just posted my question here: https://www.hahn-tech.com/ans/ttm-squeeze-green-dot-alert/
Is there a way to download historic ttm squeeze values say on a daily time frame
Not for Thinkorswim. This has already been addressed in our Q&A forum.