Strategy Equity & P/L Graph
Analyzing Strategy Outputs from Thinkorswim
In this brief article you will learn how to export the report from a chart strategy on Thinkorswim. After you export the report into a spreadsheet you will be able to crunch those number by adding custom formulas and even graphs displaying various metrics.
I decided to write this brief article for you, to give you an idea what is going to be covered in the video. If you want a more detailed set of instructions you will want to view this video instead: Thinkorswim Strategy Analysis
I’ll Show The End Result First:
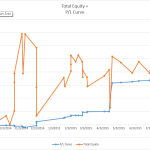
I’ll begin by showing you the end product. A graph with two lines. One plotting the Total Equity while the other plots the P/L Curve.
Strategy Equity & P/L Graph
This chart is compiled directly from data exported from the Thinkorswim platform. What you see is the result of combining data exported from six different stock charts. I’ll be honest, for Excel users, it takes an average skill level to pull this off. If you’re a novice spreadsheet user, or if they terrify you, this is probably not going to be easy. But the efforts can be so worth it. In the video, I will show you step-by-by how to put this all together. If you follow the instructions without missing any steps you should be off and running in no time.
So Just How Frightening Is This Spreadsheet?
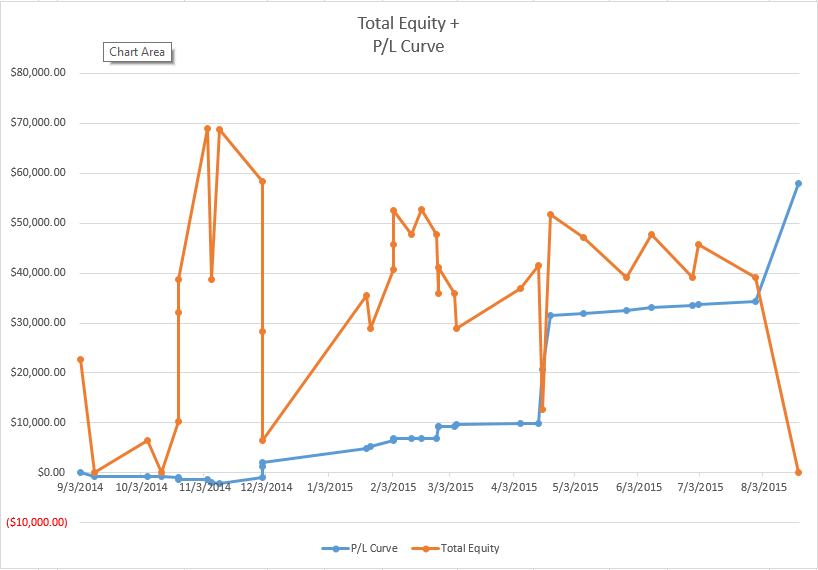
Here is a screenshot showing the strategy data from Thinkorswim pasted into an Excel spreadsheet.
Strategy Spreadsheet
This example include only a single symbol, CAT. But in the video I’ll show you how to add strategy exports from as many stocks as you can manage. There is an issue with the Date/Time column, but I’ve got a solution for it and you will see me do it step-by-step. After the Date/Time is corrected we’ll be adding 4-5 columns. I’ll show you the formula for each column. After that we simply sort the entire data set by the Date/Time column and it’s done. Once completed, it takes just a few more clicks for producing the graph displaying the Total Equity and P/L Curve.
Straight From the Source
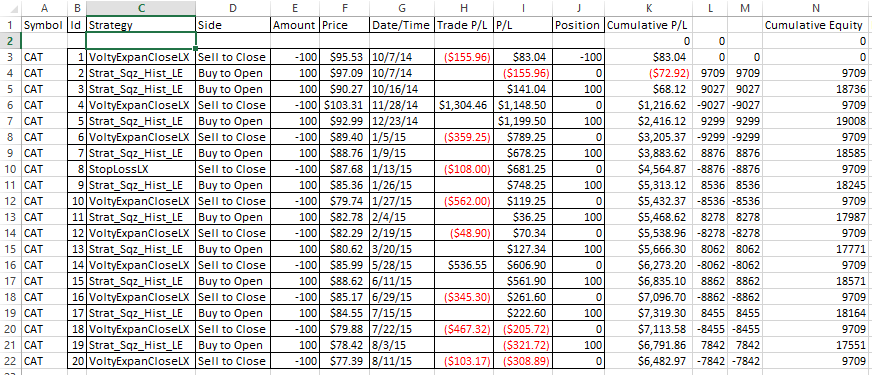
The last screenshot I’ll leave for you is the Strategy Export screen on Thinkorswim.
Strategy Report Export
This will be the first step. For each stock you want to include in the analysis, you will right-click on the charts and select “Show Report” from the menu. Next you just click the “Export File” button in the lower right and choose a location to save it. Select the next stock symbol, and repeat. Once you get all the exports done we open each report file and copy/paste the data into the spreadsheet. Most of this is what i call grunt work. If you want to include 20 or more stocks it will just take some time to get everything exported. But I suggest you start off with just 2-3 stocks for your first run. Then add more as you get comfortable with the process.
For Advanced Users Only:
Take this knowledge to the next level and learn how to automate your trades on Thinkorswim
Thinkorswim Automated Round-Trip Trades
Relax, and Enjoy the Fruit of Your Efforts!
After it’s all done, you get some very useful information about your selected strategy. Information that will help you make adjustments, optimizing for your risk tolerance and available capital. Once the video is published, I will include a link to it here at the end of this article.
Thanks for all your support. Take care everyone.
Pete I have completed the video up to the saving the chart report in to Excel. Perhaps you cover it later but most of the report from the chart have a date stamp like 3/12/22 1:30pm. Not all do but most over several days do. How to address that? Thanks in advance.
Sorry but I’m not sure what the issue is. If the date stamp incudes both date and time than it can mean one of two things. 1. it may be that you are using this on an intraday time frame. In which case the date and time is perfectly normal 2. If you are using this on a daily time frame than you probably just need to change the formatting of that column to display only the date and exclude the time.
Couldn’t you just open the csv files instead of the html files? CSV. Comma separated values. The file format specifically created for spreadsheets?
At the time this video was published there was a glitch in Thinkorswim that prevented this from working correctly. The video explains the workaround. You may use whatever method is easiest for you.
Is it possible to test a strategy across multiple stocks at the same time and get one report? I assume not based on your videos and my own playing with the platform, but thought I would ask. Thanks
You are correct in that it is not possible in the current version of Thinkorswim. There are platforms available that do. Amibroker and TradeStation are two that I know of.
1. Another great metric is just comparing net gain from strategy trading vs. just buying and holding during the duration.
2. Do you have a guide on how to do this on TradeStation? Do you feel it is worthwhile or is analysis and strategy development more of a thing you do once or rarely?
All of our TradeStation tutorials are listed here: https://www.hahn-tech.com/category/ts/
If you are looking for videos in the Chart Strategies topic for TradeStation you will find them here: https://www.hahn-tech.com/category/ts/strategies-ts/
At this time we only have one video in that topic for TradeStation.