| ♥ 0 |
What I want to know how to do is, “create a custom watchlist coulomb, so that the background color changes when the current price creates a new daily high, and changes to a different color when the last price creates a new 2-day high”.
Marked as spam
|
|
Private answer
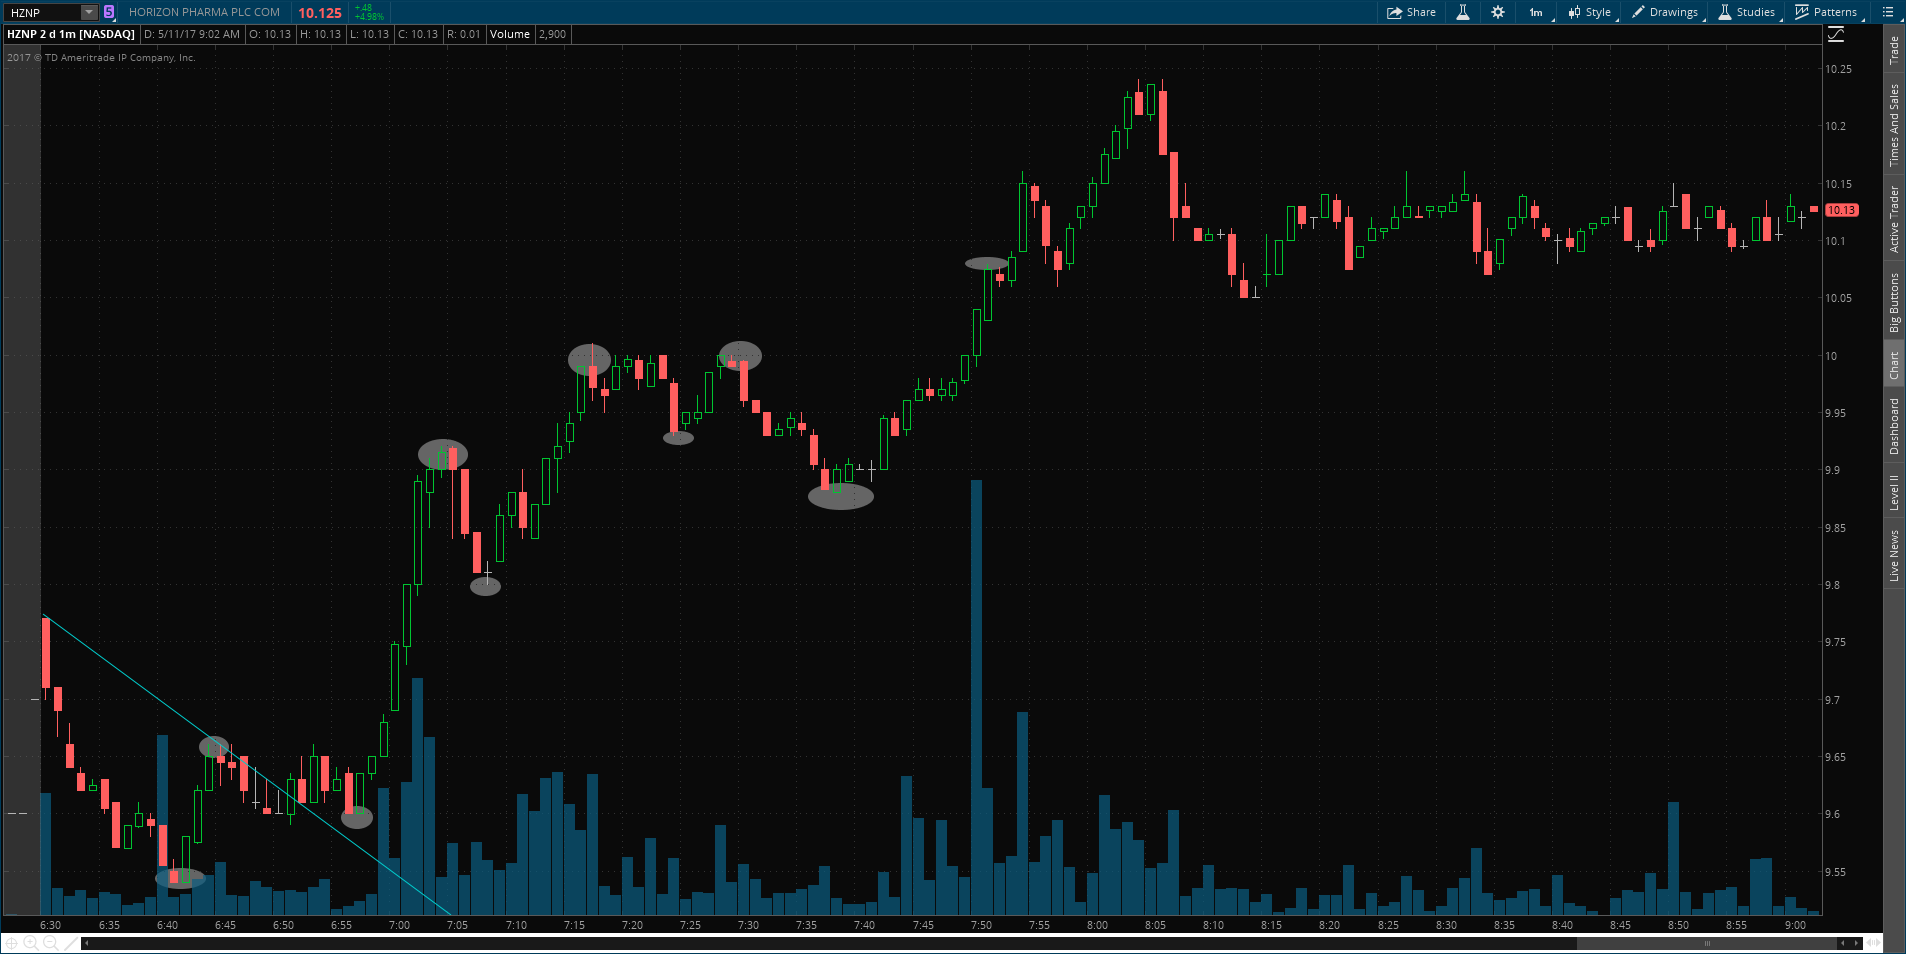
Hi Pete thanks for your codes it has been very useful. I want to know if you can create a code to add background color on the w/l that indicates new high of intraday from previous lows intraday (1min chart) for spotting a shift in momentum heading towards new high of day from opening bell dips. Picture included marks previous lows followed by new highs I’m going to donate If such a code exists and works as expected. Thanks in advance.
Attachments:
Marked as spam
Answered on May 11, 2017 9:05 am
|
|||||
|
Private answer
I just copied & pasted the code into one of the 19 custom indicators. I then placed that indicator into a watchlist. No matter what I do so far, all that comes up is “everything is showing black; no new daily high, and no new 2-day high”. Can you help me find what I’m doing wrong, or why this isn’t working. Thanks. Marked as spam
Answered on May 4, 2017 12:42 pm
|
|||||
|
Private answer
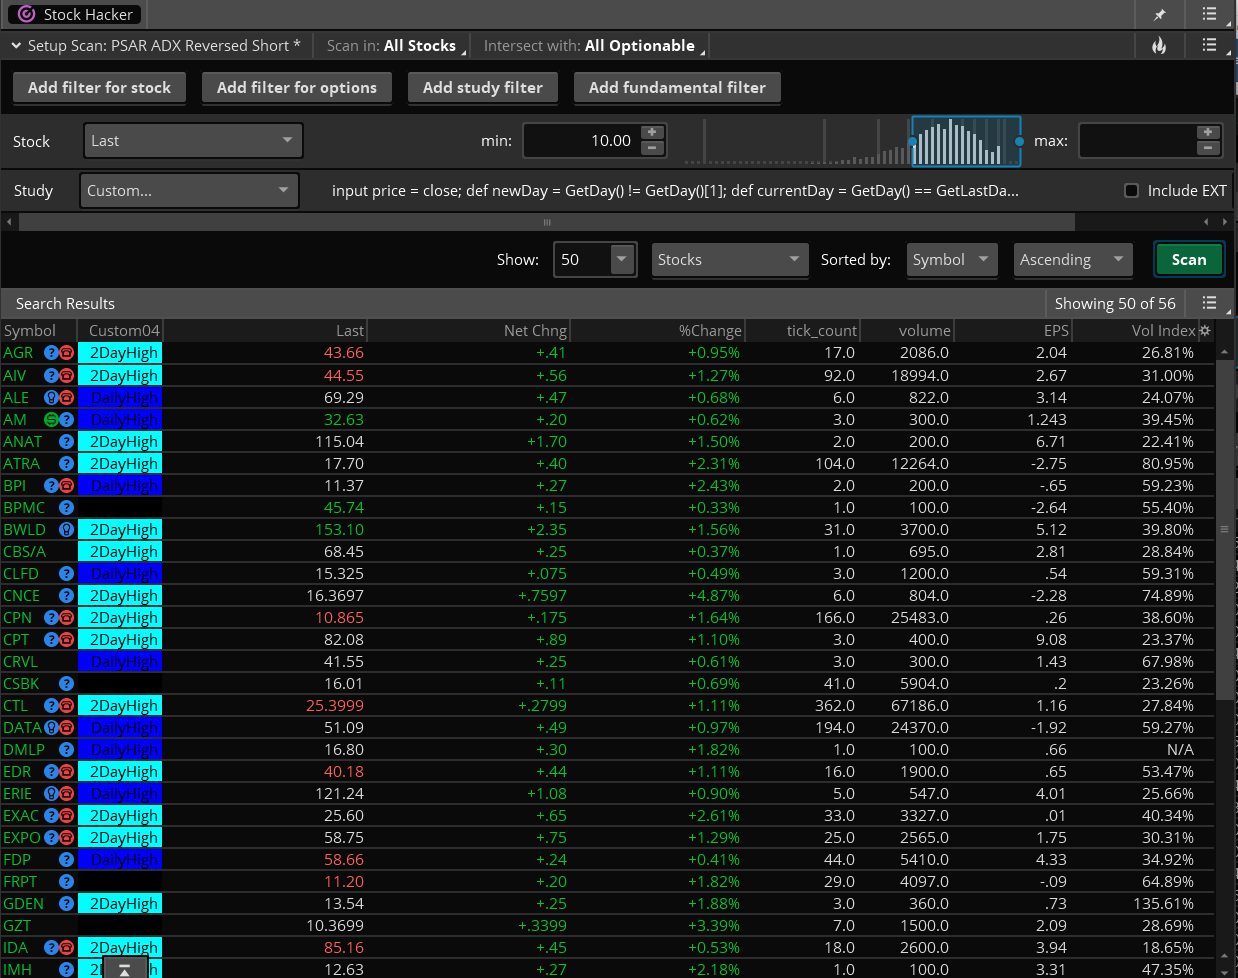
Finally getting around to working this out. This sounds like a pretty simple request but the code requires several complex elements to get the details straight. I added a special touch just to see if I could do it. Which is to have the text in the custom column change to display which condition is present. Here is the code, attached screenshot shows how it looks.
Attachments:
Marked as spam
Answered on April 17, 2017 9:10 am
|
This will need to be submitted as a new question to assist other visitors in searching for and finding your post and it’s solution. When you post this, be sure to explain exactly how you want the lows to be included in the logic. It is not apparent from your description or the screenshot. To me, it looks like you simply want to track each time a new intraday high is achieved. Which is something I’m pretty sure we’ve already covered elsewhere.