| ♥ 0 |
Hi Pete, Giving by the topic, I assume you know the headaches involved in my question. However, I think I am able to answer some of your questions & also found a study online that partially works, but need your help translating it. Ill try to address some of your previous questions as far as when pattern completed & number of bars, can you make the inputs adjustable so that the pattern would be completed based on bars specificied (i.e. between the previous 50 bars to previous 4 bars) & doubles are within a percentage. The code I found below seems to be onto something, but I\’m unable to plot it to get the full picture.
Marked as spam
Asked on July 10, 2017 7:16 am
1171 views
|
|
Private answer
There are two separate sets of indicators in that code you posted. The first one contains numerous errors. Simple mistakes like using a single ‘=’ where a double ‘==’ is required by the syntax. But there are other, more serious mistakes and there is no way to guess what the author intended to write in those cases. The second one is incomplete. It may be that you ran out of space in the comment section and the rest was truncated. With code of this size, best to save it as a .txt file and attach it to the question. You can try attaching the full code as a text file. But if these errors are still present there is nothing I can do with this code. Marked as spam
Answered on July 10, 2017 8:30 am
|
|||||||||
|
Private answer
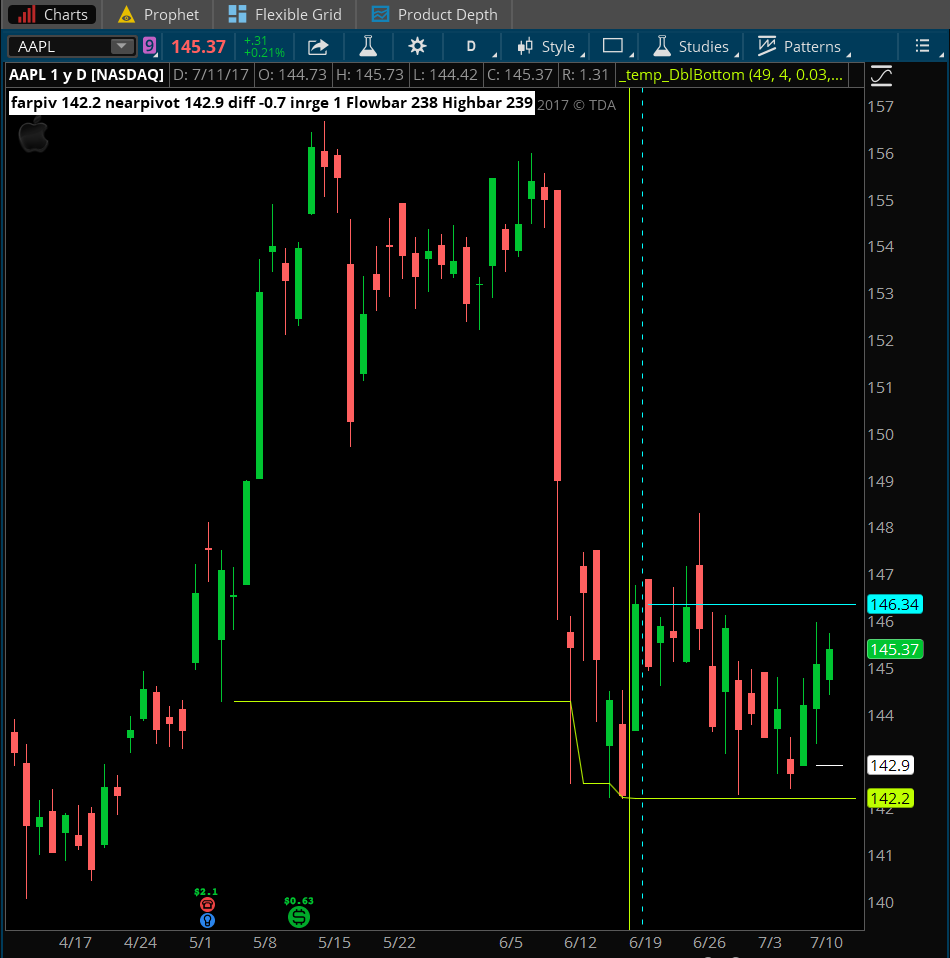
Ok, now that we have the original source code. I find that the code from that post works just as it is. There is no need to modify it to plot on a chart. See screenshot attached. So now that we have a functioning indicator, which of the plots did you want to use for the scan? Attachments:
Marked as spam
Answered on July 11, 2017 7:53 am
|
|||||||||
|
Private answer
Is there a way to plot a signal (arrow or line) when there’s a double top or double bottom? I realize different time frames will need different settings & different % of top/bottom differences. However, I don’t currently understand the inputs or the shortfalls of the current scan. Could I create text alerts off this scan? Does this scan create false signals? Essentially, I’m looking for the best way to create a timely double top/double bottom signal that would allow to enter a position before the next move. Possibly adding a plot of arrows when the second top or second bottom is forming. Marked as spam
Answered on July 11, 2017 9:59 pm
|
|||||||||
|
Private answer
It has been brought to my attention the original source code is no longer available at the link provided by the original author of this post. I am providing that code as an attached plain text file immediately below this answer. The name of the attached is "DoubleBottom.txt". Click the link by that name immediately below this answer to access that code. Marked as spam
Answered on December 18, 2020 12:30 pm
|