Adding Custom Columns to a Watchlist in Thinkorswim
Thinkorswim Custom Watch List Columns
Tired of looping through dozens of charts just to find the few stocks that meet your criteria? Wouldn’t you rather just glance at your watch list and instantly see those half dozen stocks all sorted at the top of your list? Looking for the needle in the haystack can be tedious and time consuming. This video demonstrates how to combine the power of a custom watch list column with a custom scan. Running live on an active market, these two tools combine to create a dynamic filtering engine to help you find those little nuggets that take you hours to uncover. The link below is to download the source code for the custom column indicator demonstrated in the video. Just follow the instructions in the video to create your own custom column in a watch list.
Learn More:
Click and drag interface to build custom watchlist columns. No code experience required:
Thinkorswim Condition Wizard Watchlist
DISCLAIMER: I AM NOT A CERTIFIED FINANCIAL ADVISOR AND NOTHING IN THIS VIDEO OR TEXT IS AN ADVERTISEMENT OR RECOMMENDATION TO BUY OR SELL ANY FINANCIAL INSTRUMENT. NOR IS THIS VIDEO OR TEXT INTENDED TO INSTRUCT YOU ON HOW TO MAKE BUY OR SELL DECISIONS USING ANY OF THESE INDICATORS.
*Thinkorswim is a chart analysis platform offered by Charles Schwab: https://www.schwab.com/
Charles Schwab provides financial services including the trading of Stocks, Futures, Options and Forex.
Please be sure to share this page with your friends and colleagues. Leaving comments below is the best way to help make the content of this site even better.
Would it be possible to create a dynamic watchlist with the TTM Squeeze?
Hi Pete. I found your website about 2 weeks ago and it is awesome. Thank You! I reviewed the QA forum and was able to set up the squeeze histogram color in my watchlist. Can you help me with customizing my watchlist so that the color of the TTM C wave histogram appear in my watch list? I reviewed the post that explains how to assign a color to the A wave but I am having trouble with creating a code for the C Wave histogram.
Hi Corey, go ahead and submit this as a new request in our Q&A forum.
Pete- thanks for this..very useful indeed. Can this be done- I wanna add 5 custom columns and use them in a watchlist..where I wanna practise – paper trading but w realtime data …so its as follows…col 1 is cost basis- which I will provide based on what price I bought XYZ stock, col2 is cost total (calc as pos qty X col 1) ; col 3 is buy trigger (a 4 decimal place price I provide based on tech/fund anal); col 4 is sell trigger (another 4 decimal price field I provide); col 5 will be action status (calc. as display “BUY” when current price is 105% or less of col 3 and display “SELL” when current price is 95% or more of value in col 4). Can this be done in paper trading or realtime connected trading mode?
Also, will I be able to send alerts txt or email when buy or sell trigger is hit?
No. Once again this is not supported by custom watchlist columns. Notifications of any kind are not possible from any custom watchlist column.
No, sorry. This is not at all how the custom columns function. There is no way to for any custom column to read any data from any other column in the watchlist. They are not connected and there is no way to connect them.
do u know of any other platform like schwab etc (any other than TOS) where these 5 columns can be created and used to trigger real time alerts? Also does TOS or any other platform offer API calls for real time price data that I can use in goog. sheets as I have setup these column in goog sheets but problem is that goog updates get limited to once every 5-8mins
Ok, that makes sense. You have a spreadsheet solution. No platform is going to be able to apply a spreadsheet solution to a watchlist. This may seem like a small detail but it’s important you grasp the difference in order for you to understand how to find what you are looking for. Sierra Chart provides spreadsheet solutions. So if you have a spreadsheet solution and want to apply that to live or automated trading. Sierra Chart is the platform for you.
Peter, I want to scan and filter all the stocks (S&P, DOW, etc) to find specific stocks to screen and find stocks that find a specific parameter such as “IV percentile”. How can I do this? We are using TOS platform, you are a Rock Star!
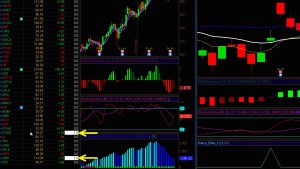
I see in this video that the watch list is running and updating all day as price crosses the EMA. Can I get this to operate the same way on say the TTM Squeeze Histogram, as price changes the colors change throughout the day? Is that a function of using the Plot Scan statement? I guess what I am saying is I want every indicator I put in the watch list as it switches from low to high or crosses to update and give me an assigned color in real time as price changes all day.
On this very same page…. did you have look over at the left hand side of the browser, where we have a navigation menu showing a list of all videos in this same topic?
Been a TOS user for 2 yrs… just understanding scripts thanks to your custom watch list video… can I write a code that will allow for a (1) to appear in the custom column when the 10 day MA crosses either above or below the 20 day MA?
Sure thing. Oddly enough this has not been requested in our Q&A forum yet. Go ahead a post this request in the Watchlist topic.
So far I love the Custom Column. Unfortunately, I have to write 3 different scripts and use on different aggregation period namely Monthly, Weekly, and Daily and that used up my limited amount of Customize Columns that I can have. What is the way to add that option so that I can just have one script but I can just select an option to set the timeframe??? Greatly appreciate you for the help and the time.
I hear what you are saying. We have a limited number of custom columns. There is no way that I know of to use the same one for different time frames.
You can “share” your own column, then open the shared column to obtain a new column.
You can do this multiple times and just change the timeframe and the name to speed up adding columns with the exact code when you need multiple instance for different time frames. Or you can open a shared column and then change the name to something generic and just delete the column contents – then you have a fresh column.
Took me awhile to figure that out – I thought I ran out of the limited number of custom columns too. But if you share it to yourself then you yield a new custom column!
To “share” open up the script panel in the columns editing menu and then open up the colum script and click on “share” in the top right corner of the editor. Next open your shared items panel and copy the link. Finally go to your main screen to the “open shared items” menu and copy the link to rename it. Hope this helps everyone.
That’s awesome. Thanks for taking the time to share this.
Just wanted to thank you for posting this. I am going to check it out. I am new to TOS but really like the vast array of customization available. Would it be difficult to have the same kind of EMA break study but for breakout on upper Bollinger Bands (of multiple timeframes)? I am not the best programmer, prob could do it if given enough time. Do you offer this kind of customization as a service?
(For example: Price > Upper Bollinger band (20,2 – weighted) on 5 min), (.. 15 min), (.. 30 min), etc with customization allowed for bollinger period, dev, weight). use yellow color when price > 5 min upper bb, price > 15 upper bb.,etc. Going to try to apply your example first as I think you have the basic framework. Thanks again
Hi Doug. Glad you know you found the video helpful. Always great to see when viewers get new ideas after viewing our videos. As to your specific question. We cannot apply more than a single time frame to a column in a watchlist. Each watchlist column is assigned its own time frame. In order to represent more than one time frame in a watchlist requires that you additional custom columns, one for each time frame.
thank you Pete.
TOS has script in the custom column that allows one to dropdown menu to select different time frame. eg. Woodiespivot or ADXCropssover , etc. Once you add to the current set…you have the option to select or choose which time frame. Any help from others is much appreciated.
Yes. And this only applies to the standard columns that Thinkorswim provides. There is no way to do this with custom columns.
Mr Han,
Is it possible to add a custom column which will display when the symbol was added to the watch list for intraday trading ?
thanks.
No this is not possible.
thanks for this effort Pete- could u suggest how can I add 3 custom columns to use in watchlists (which I want to use as strategy evaluation)- 2 of those columns will be user entered by me- Qty, purchase price and the third calculated as running P/L for position- calculated as qty * (last price- purchase price). Thanks
You cannot do this with a watchlist in Thinkorswim. You would need to use a spreadsheet for this.