Implied Volatility Percentile Displayed on a Chart
ATTENTION:
It appears that Thinkorswim uses the term “IV Percentile” on their platform but in reality the value it displays is “IV Rank”. This causes some confusion among seasoned options traders who understand the difference. So I wanted to make this clear right up front that the current version of Thinkorswim is using the wrong term.
Thinkorswim computes IV Rank but reports it as IV Percentile. Since this premium indicator only works for Thinkorswim, it has been configured to match Thinkorswim, even though Thinkorswim is not using the correct name for this metric. (This IV Rank, it is not IV Percentile).
IV Rank Formula: (current IV - 12 month IV Low) / (12 month IV high - 12 month IV Low)
IV Percentile Formula: (number of days below current IV) / (252)
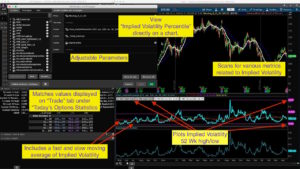
Is implied volatility high or low? How does it’s current value compare to historical values? What happens to implied volatility after an earnings release? Now, for the first time, view critical data associated with implied volatility directly on a chart. This indicator plots many of the same metrics currently only available on the Trade tab, under “Today’s Options Statistics”. That data is shown only for the 52 week high and low. But this indicator will even show you the 6 months implied volatility percentile. And those time spans are ADJUSTABLE! But wait, there’s more…. Yes, this premium indicator also comes with a stock scanner. And because we have a fast and a slow moving average of implied volatility, you can now run custom scans to search for stocks that have implied volatility trending higher or lower.
Interested in purchasing this premium indicator? Scroll down below the video to access the order form.
- Indicator Type: Volatility
- Indicator Basis: Implied Volatility
- Time Frames: Daily time frame or higher
- Trade Setups: Options (singles and spreads)
Built to the specifications of one of our viewers. At the viewer’s request we are experimenting with this as a ‘Crowd Sourced” premium indicator. Pricing on this indicator will be based on how many interested buyers contact us during the first week after publishing this video. If we meet the minimum number of buyers in the first week, we’ll post this indicator for sale to the general public and everyone will get a huge discount on a great custom indicator. You will not be billed until a final price is determine and you agree to that price. Click the link below to access our premium indicators sales page.
Thinkorswim Premium Trading Tools
Watch the video, Thinkorswim Volume Profile Study below:
DISCLAIMER: I AM NOT A CERTIFIED FINANCIAL ADVISOR AND NOTHING IN THIS VIDEO OR TEXT IS AN ADVERTISEMENT OR RECOMMENDATION TO BUY OR SELL ANY FINANCIAL INSTRUMENT. NOR IS THIS VIDEO OR TEXT INTENDED TO INSTRUCT YOU ON HOW TO MAKE BUY OR SELL DECISIONS USING ANY OF THESE INDICATORS.
*Thinkorswim is a chart analysis platform offered by TD Ameritrade: www.tdameritrade.com
Charles Schwab provides financial services including the trading of Stocks, Futures, Options and Forex.
Please be sure to share this page with your friends and colleagues