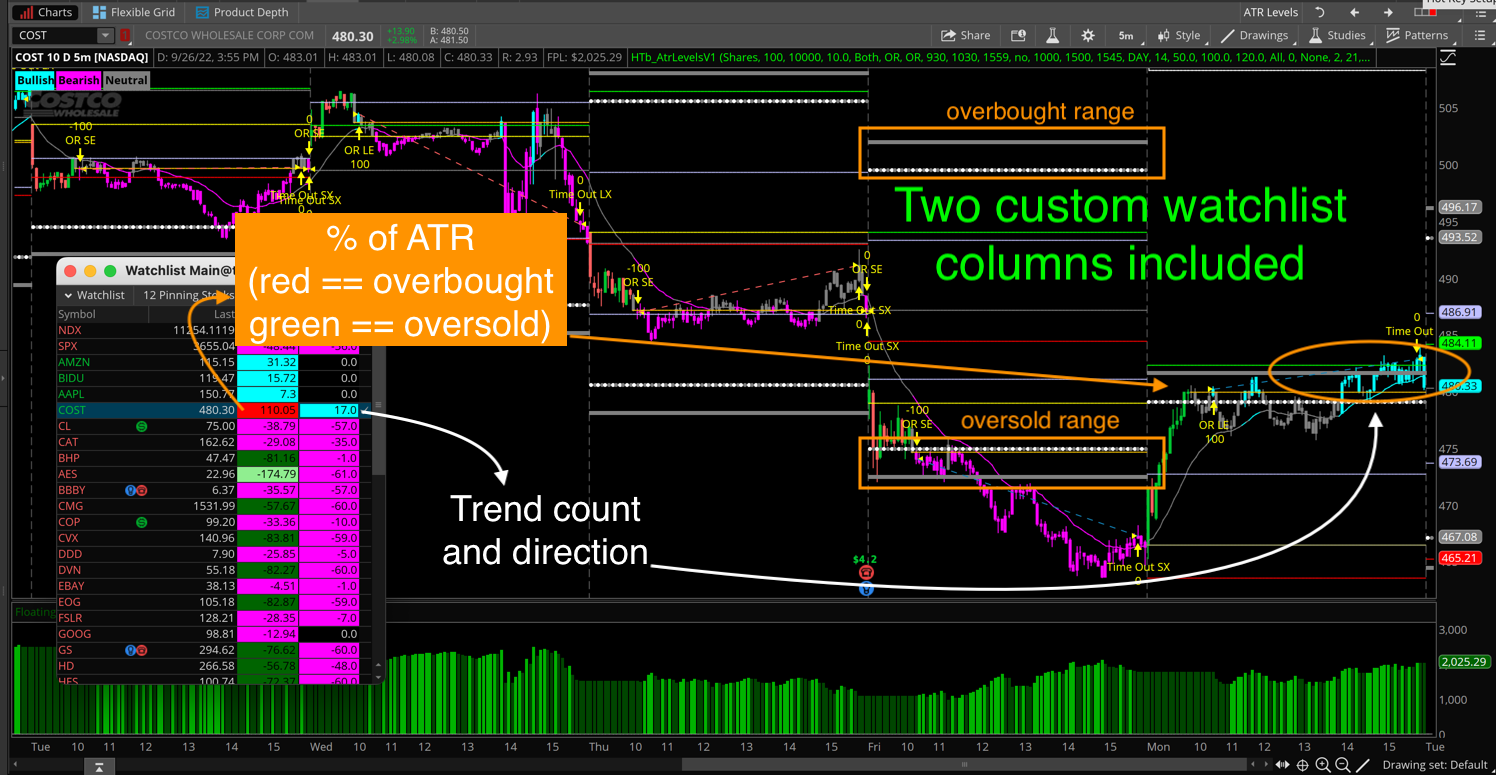
Dynamic Overbought/Oversold Levels Plotted On the Chart
“Thinkorswim ATR Levels V1”, originally published for TradeStation, has been massively upgraded and converted to work on Thinkorswim. Uses a higher time frame ATR to plot support & resistance levels which dynamically adjust to changing volatility in the price action. Mid levels serve as minor support & resistance level and the Max and Ext levels serve as overbought/oversold levels. Can be adjusted to plot on intraday charts and higher. Be sure to view the demo video named “Thinkorswim ATR Levels V1” to learn about all of the features and supported time frames.
List of main features:
- New Chart Strategy for back-testing entry/exit signals
- Upgraded Chart Study
- Two New custom watchlist columns
- Upgraded custom scan to include new settings
Is this indicator a good fit for me?
Trying to decide if this indicator is a good fit for your current trading setups? That’s awesome! I have prepared a short list of 5 question to help guide your decision process. Open the following PDF document to view those questions now:
You will also find the following topics in the demo video are geared toward informing your decision to purchase:
- 0:20 Overview
- 36:09 List Of Features
- 2:14:10 Example Charts
I have also provided a PDF document which provides a list of main features.
| Topics | Start Time |
| Overview | 0:00:20 |
| Where to Buy | 0:08:55 |
| Installation & Setup | 0:18:36 |
| List of Features | 0:36:09 |
| Chart Strategy Settings | 0:43:02 |
| Chart Study Settings | 1:19:47 |
| Look & Feel Settings | 1:46:12 |
| Scan | 2:01:09 |
| Example Charts | 2:14:10 |
| Live Demo | 2:20:29 |
Intellectual Property Notice:
Source code is not included with these indicators. The source code has been obfuscated to prevent unauthorized changes and protect intellectual property.
Need more information?
To get pricing and see how to place your order click the link below.
Thinkorswim Premium Trading Tools
Watch the video, ATR Levels V1 below:
DISCLAIMER: I AM NOT A CERTIFIED FINANCIAL ADVISOR AND NOTHING IN THIS VIDEO OR TEXT IS AN ADVERTISEMENT OR RECOMMENDATION TO BUY OR SELL ANY FINANCIAL INSTRUMENT. NOR IS THIS VIDEO OR TEXT INTENDED TO INSTRUCT YOU ON HOW TO MAKE BUY OR SELL DECISIONS USING ANY OF THESE INDICATORS.
*Thinkorswim is a chart analysis platform offered by TD Ameritrade: www.tdameritrade.com
Charles Schwab provides financial services including the trading of Stocks, Futures, Options and Forex.
Hi Mr Hahn,
Was interested in buying this for intraday trading but does it work for futures market as well? Or do you suggest to stick strictly to stocks ?> Thank you
I believe the best answer to your question will be found within the demo video. There are two sections in particular you will find helpful. The section named “Example Charts” and the section named “Live Demo”. However if you view the entire demo video you will find examples of Futures charts throughout. The demo video is a NOT a market tool. It’s the instruction manual. So viewing the demo video is essential. Otherwise you will have no idea how to install it, adjust it’s settings or use any of the advanced features.
Hi Pete, I am new at this, I use think or swim. I I’m thinking of buying the ATR Levels SR/ORB trading tool, I do use SR levels, volume (over and underbought) in my analysis. I also back test (I suppose this means to use the tool on past events, sorry english is not my maiden language and I get confused, nevertheless your videos are very well explained, thanks for that).
My goal is to create a long position portfolio with stocks to hold up to 6 months or less and achieve a return between 7 to 10 percent (of course i am not holding the tool or yourself responsable for the success or failure of my trades) I just wanted your recommendation, is this the best tool or would you recommend another ?
Thanks for your time and effort
Best regard
Anibal
Thanks for taking the time to inquire about our professional trading tools and describing your goals for trading. You describe what I would call “Swing trading”. Which is when you take a temporary position in the market, typically based on the daily time frame, and at the time you open the position have predefined profit and loss targets.
Since this is your goal I do not recommend the ATR Levels indicator. This indicator is best suited for intraday trading. (Day trading). Yes, the levels can be helpful when applied to a weekly or monthly time period. But there are other tools available which are more suited towards swing trading.
For swing trades, I am currently using the Standard Deviation Reversals. I completed back-testing and found some parameters which seem to work well on SPY, IWM And DIA. We have two other trading tools which are ideally suited to swing trading and that would be the Divergence indicators and the Swing Pivot Trend Rotations.
So based on your stated goals, I suggest you review those other indicators to see which one is a better fit for your current trading methodology.