Marks Trend Reversals Based on Standard Deviation Channels
Trend lines and trend channels. Many traders are using them incorrectly, and hand-drawn trend lines are subject to user bias. The human eye can deceive us into seeing profitable setups where only ghosts are present. That’s why we need a standardized method. “Thinkorswim Standard Deviation Reversals V1” is not influenced by human bias and applies a purely logical method of determining trend reversals. This indicator plots on all available time frames on Thinkorswim. Be sure to view the demo video named “Thinkorswim Standard Deviation Reversals V1” to learn about all of the features and supported time frames.
List of main features:
- Chart Strategy for back-testing entry/exit signals
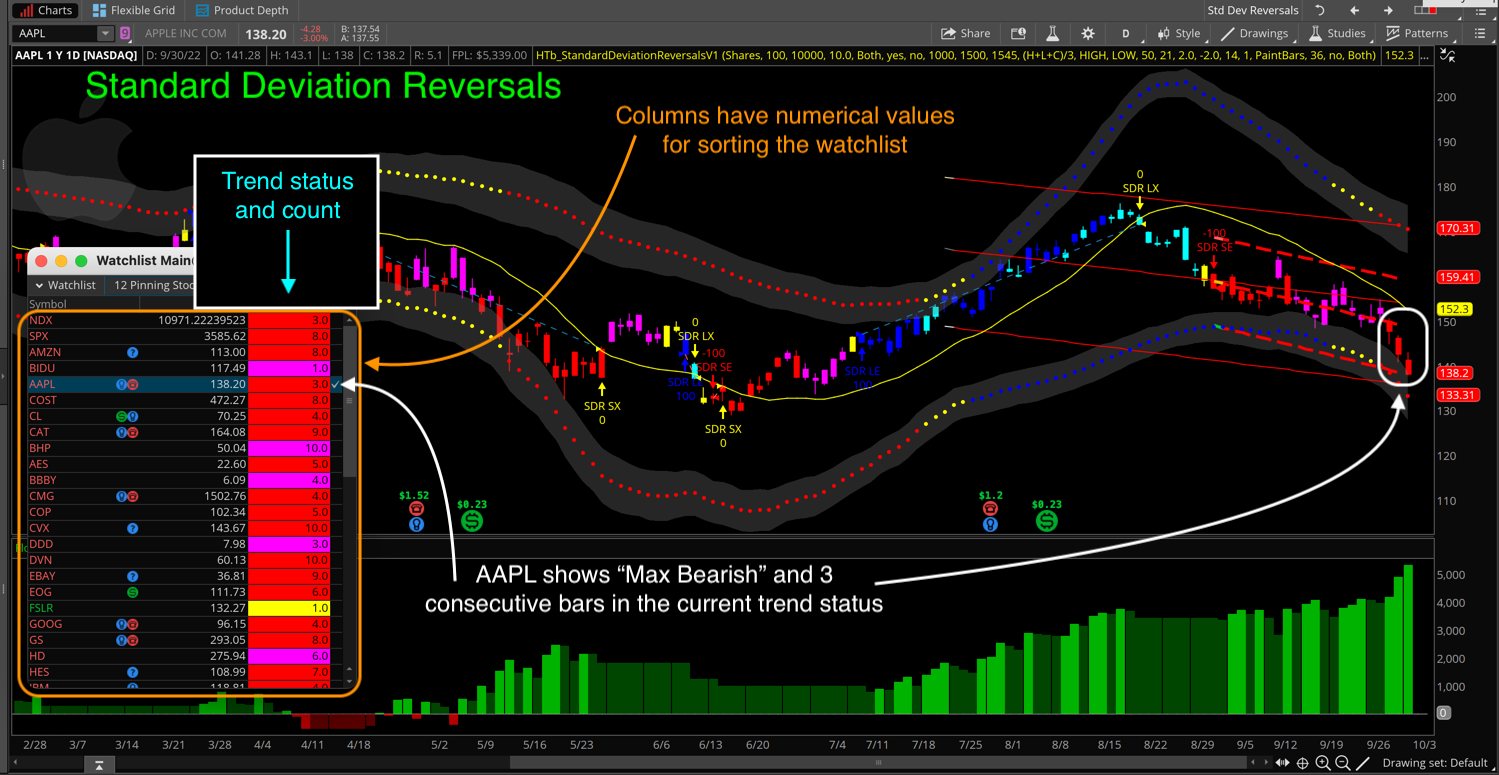
- Chart Study displaying trend reversals through five distinct trend stages
- One custom watchlist column showing trend stage and consecutive bars in current trend
- Custom scan to based on the same data points as the custom watchlist column
Is this indicator a good fit for me?
Trying to decide if this indicator is a good fit for your current trading setups? That’s awesome! I have prepared a short list of 5 question to help guide your decision process. Open the following PDF document to view those questions now:
You will also find the following topics in the demo video are geared toward informing your decision to purchase:
- 0:20 Overview
- 34:07 List Of Features
- 1:30:33 Example Charts
I have also provided a PDF document which provides a list of main features.
| Topics | Start Time |
| Overview | 0:00:20 |
| Where to Buy | 0:12:08 |
| Installation & Setup | 0:19:51 |
| List of Features | 0:34:07 |
| Chart Strategy Settings | 0:41:31 |
| Chart Study Settings | 0:56:57 |
| Look & Feel Settings | 1:06:06 |
| Scan | 1:15:22 |
| Example Charts | 1:30:33 |
| Live Demo | 1:36:27 |
Intellectual Property Notice:
Source code is not included with these indicators. The source code has been obfuscated to prevent unauthorized changes and protect intellectual property.
Need more information?
To get pricing and see how to place your order click the link below.
Thinkorswim Premium Trading Tools
Watch the video, Thinkorswim Standard Deviation Reversals V1 below:
DISCLAIMER: I AM NOT A CERTIFIED FINANCIAL ADVISOR AND NOTHING IN THIS VIDEO OR TEXT IS AN ADVERTISEMENT OR RECOMMENDATION TO BUY OR SELL ANY FINANCIAL INSTRUMENT. NOR IS THIS VIDEO OR TEXT INTENDED TO INSTRUCT YOU ON HOW TO MAKE BUY OR SELL DECISIONS USING ANY OF THESE INDICATORS.
*Thinkorswim is a chart analysis platform offered by TD Ameritrade: www.tdameritrade.com
Charles Schwab provides financial services including the trading of Stocks, Futures, Options and Forex.
I forgot to ask if you have applied your SDRV1 to option trading?
I have not. But that is a really great idea. I would suspect that those Std Dev bands just might make really good price levels to sell premium. (Not investment advice!). But you would have to time the entry so you catch the market when it begins to consolidate. I suggest you back-test this with your own ideas and see if there is something there worth trading.
I stopped the video at minute 20 because if you don’t have your SDRV1 available for download in MAC computers, I have no use for it.
Please advise.
I use a Mac computer myself. 2021 16″ MBP with M1Pro chip. Thinkorswim has always worked on Mac computers as well as Windows computers. I use Windows in the demo video because 99% of my client’s are using Windows instead of Mac.
Indicators on Thinkorswim are not restricted to one specific operating system. All indicators on Thinkorswim work on both Windows as well as Mac. That being the case. my premium trading tools work identically on both operating systems.
And the installation instructions are nearly identical no matter whether you are using Windows or Mac. So if it’s the installation instructions that have you stumped, we can work through that very easily.
I wonder if your Premium TOS Indicator, Standard Deviation Reversal V1 could reused with Heikin Ashi candles instead of regular candles as you structured now. But more importantly, will this change improve the efficiency of your study?
If the answer is no, please tell me how can I buy your SDRV1 and how can I install it in my TOS platform.
Thanks for inquiring about this premium indicator for Thinkorswim. On Thinkorswim, the Heiken Ashi chart is a “chart style”. It does not impact any of the studies you apply to your charts.
You can test this yourself by opening two charts side by side. Set one to standard candles and the other to Heiken Ashi. Place a 50 period SMA on each. Then observe the values of that SMA at any date/time point within those charts. The values are identical.
This is the answer to your question. On Thinkorswim, the Heiken Ashi chart does not change the computations or behavior of any chart study, including this one you are asking about.
Your second question is answered within the demo video on this very same webpage. Just view the demo video and it will explain how to purchase this indicator. And the demo video also includes the installation and setup instructions.
Please let me know if you have any further questions.
Thanks!