Five Chart Strategies For Back-testing Exits
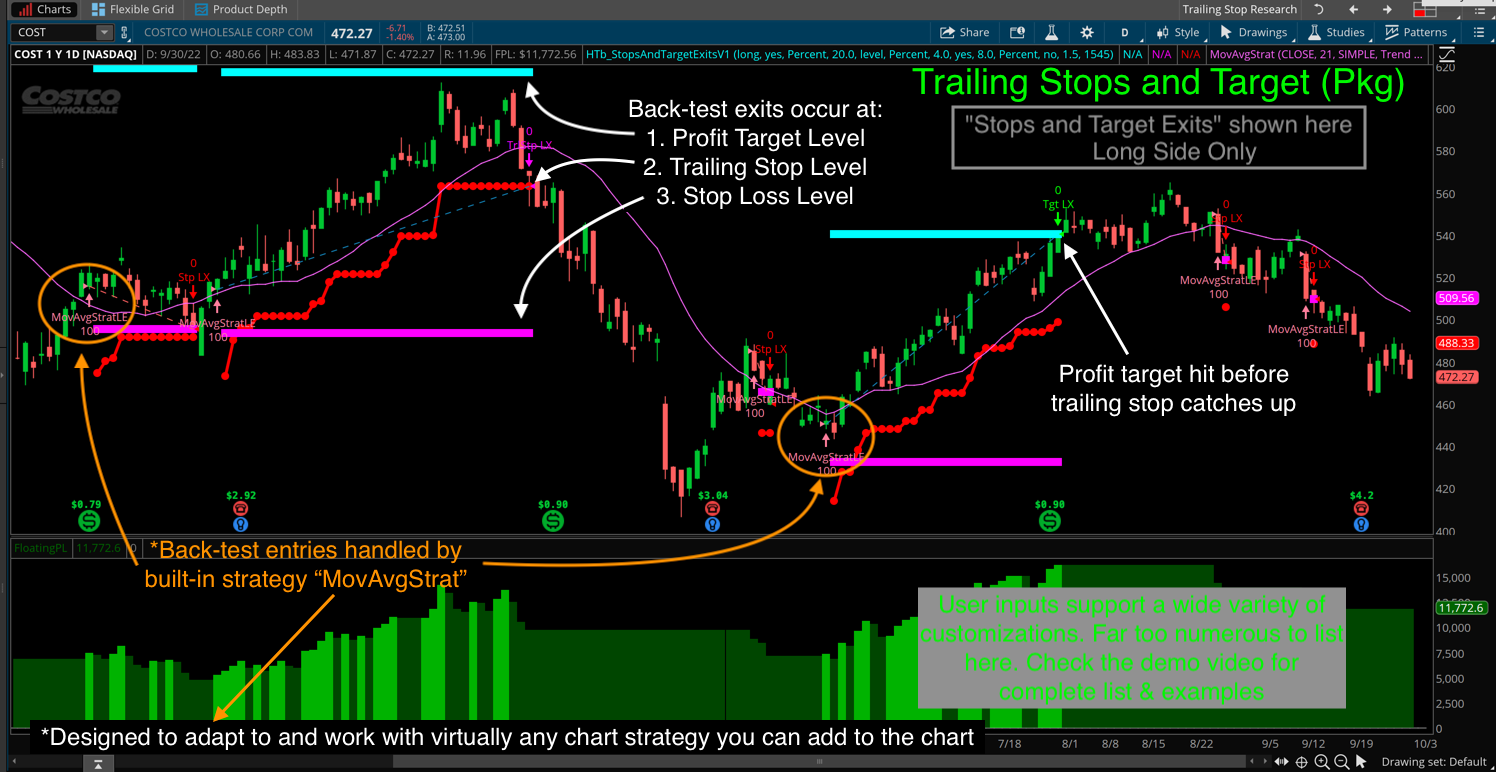
Do you like to back-test and optimize your trading setups? Are you disappointed by the standard exit strategies included with Thinkorswim? Then you should consider buying “Thinkorswim Trailing Stops and Targets V1”. This package includes chart strategies to back-test exits based on profit target and stop loss, Parabolic Trailing Stops and ATR Trailing Stops. Can be adjusted to plot on intraday charts and higher. Be sure to view the demo video named “Thinkorswim Trailing Stops and Targets V1” to learn about all of the features and supported time frames.
List of main features:
- New Chart Strategy for back-testing entry/exit signals
- Upgraded Chart Study
- Two New custom watchlist columns
- Upgraded custom scan to include new settings
Is this indicator a good fit for me?
Trying to decide if this indicator is a good fit for your current trading setups? That’s awesome! I have prepared a short list of 5 question to help guide your decision process. Open the following PDF document to view those questions now:
You will also find the following topics in the demo video are geared toward informing your decision to purchase:
- 0:20 Overview
- 21:10 List Of Features (Stops and Target Exits)
- 56:29 List of Features (Trailing Parabolic Exits)
- 1:23:20 List of Features (Trailing ATR Exits)
- 1:46:03 Example Charts
I have also provided a PDF documents which provides a list of main features for each item in this package.
| Topics | Start Time |
| Overview | 0:00:20 |
| Where to Buy | 0:11:08 |
| Installation & Setup | 0:16:49 |
| List of Features (stops & target exits) | 0:21:10 |
| Chart Strategy Settings (stops & target exits) | 0:26:15 |
| Win/Loss Ratios | 0:49:57 |
| List of Features (trailing parabolic exits) | 0:56:29 |
| Chart Strategy Settings (parabolic exits) | 1:01:07 |
| List of Features (trailing ATR exits) | 1:23:20 |
| Chart Strategy Settings (trailing ATR exits) | 1:23:53 |
| Live Demo (stops and target exits) | 1:32:33 |
| Live Demo (trailing parabolic exits) | 1:35:20 |
| Live Demo (trailing ATR exits) | 1:40:17 |
| Example Charts | 1:46:03 |
Intellectual Property Notice:
Source code is not included with these indicators. The source code has been obfuscated to prevent unauthorized changes and protect intellectual property.
Need more information?
To get pricing and see how to place your order click the link below.
Thinkorswim Premium Trading Tools
Watch the video, Thinkorswim Trailing Stops and Targets V1 below:
DISCLAIMER: I AM NOT A CERTIFIED FINANCIAL ADVISOR AND NOTHING IN THIS VIDEO OR TEXT IS AN ADVERTISEMENT OR RECOMMENDATION TO BUY OR SELL ANY FINANCIAL INSTRUMENT. NOR IS THIS VIDEO OR TEXT INTENDED TO INSTRUCT YOU ON HOW TO MAKE BUY OR SELL DECISIONS USING ANY OF THESE INDICATORS.
*Thinkorswim is a chart analysis platform offered by TD Ameritrade: www.tdameritrade.com
TD Ameritrade provides financial services including the trading of Stocks, Futures, Options and Forex.
Hi Pete,
I have some questions on the trailing parabolic SAR exits. If I want to use them for standalone long entries, I think the logical strategy to use is HTb_TrailParabolicSXv1 because short exit (buy to close) is like long entry (buy to open/auto). But the input option “allow long entries” is in the HTb_TrailParabolicLXv1 strategy.
When I put up two charts with a slightly modified parabolicSAR study and HTb_TrailParabolicLXv1 strategy side-by-side using intraday /ES (S&P500 futures) 30-day 5min bars, I noticed the dots didn’t match most of the time, and the long entries also didn’t match. This slightly modified parabolicSAR study is from the usethinkscript.com
I have captured 2 images, modified parSAR and HTb_TrailParabolicLXv1 side-by-side, and modified parSAR and original TOS parSAR side-by-side. But I don’t know how to include them in the comment box.
Sorry but I have to admit that despite reading your question several times I am totally lost as to exactly what you are asking. If you want to use one of my TrailParabolic chart strategies for long entries, your only option is to use the file named HTb_TrailParabolicLXv1 .
If you are trying to get the dots to line up with other forms of Parabolic trailing stops don’t waste any more time doing that. They will never match. The modifications forcing the dots to remain on the long side of price action means the dots will never line up with other solutions.