Converting a Scan to a Strategy (and vise versa)
Thinkorswim Scan To Strategy
Do you know how to convert a custom Scan on Thinkorswim into a custom Strategy? You will not believe how simple it is. This video shows the step-by-step instructions on how to convert custom Scans into custom Strategies. There is also a quick demo of how to convert a Strategy back into a Scan. After watching this video you will be better equipped to take your trading ideas and put them into practical use. You will be able to build strategies that meet your trading plan and then convert them into a scan that will deliver verified entry signals right to your watch list.
This video builds upon the foundations laid in four previous tutorials. This video assumes you already have a good understanding of custom studies and strategies on the Thinkorswim platform. If you haven’t seen them already, it’s best to view them first.
Thinkorswim Custom Scan Stochastic MACD
Thinkorswim Scan TTM Squeeze Histogram
Thinkorswim Scan MACD RSI Part Two
For Advanced Users Only:
Take this knowledge to the next level and learn how to automate your trades on Thinkorswim
Thinkorswim Automated Round-Trip Trades
DISCLAIMER: I AM NOT A CERTIFIED FINANCIAL ADVISOR AND NOTHING IN THIS VIDEO OR TEXT IS AN ADVERTISEMENT OR RECOMMENDATION TO BUY OR SELL ANY FINANCIAL INSTRUMENT. NOR IS THIS VIDEO OR TEXT INTENDED TO INSTRUCT YOU ON HOW TO MAKE BUY OR SELL DECISIONS USING ANY OF THESE INDICATORS.
*Thinkorswim is a chart analysis platform offered by TD Ameritrade: www.tdameritrade.com
TD Ameritrade provides financial services including the trading of Stocks, Futures, Options and Forex.
Please be sure to share this page with your friends and colleagues. Leaving comments below is the best way to help make the content of this site even better.
Hi Pete,
I don’t see exactly the same thinkScriptEditor as you copy and pasted.
Here’s what I see;
input price = close;
input displace = 0;
input length = 20;
input Num_Dev_Dn = -2.0;
input Num_Dev_up = 2.0;
input averageType = AverageType.Simple;
def sDev = stdev(data = price[-displace], length = length);
plot MidLine = MovingAverage(averageType, data = price[-displace], length = length);
plot LowerBand = MidLine + num_Dev_Dn * sDev;
plot UpperBand = MidLine + num_Dev_Up * sDev;
LowerBand.SetDefaultColor(GetColor(0));
MidLine.SetDefaultColor(GetColor(1));
UpperBand.SetDefaultColor(GetColor(5));
Where should I add Comment and Plot Statement as you did on your video. Please help.
Thank you.
Joe
Did you view the four videos that were listed as prerequisites prior to viewing this video?
I am sorry if I am posting this twice, but I cannot see my previous post. My question is why cant I see my customs scan under the User Defined Studies in order to copy and try it as a strategy. Isnt a Scan a Study ?also
Your original comment was located immediately below this one. Since you could not locate the original comment I removed it so I could respond to this one. Adding a custom scan to Thinkorswim does not automatically add a new custom chart study. While it is possible to reference a custom chart study from within the code of a custom scan, the process does not work in reverse.
ok. thank you Mr. Hahn.
The scan to strategy should work in a way so that if strategy condition triggers in the last bar or within x bars it should trigger, not because it triggers at some old time in the past. simply scanning to strategy doesn’t do that. How can we scan so that it shows only the ones that are triggers on the last day?
I’m really not sure what you are asking here. You seem to be implying that scans are returning results for signals that took place many bars ago. That is not the case. You have to purposely create your scan to look to the left the most recent bar available. The vast majority of scans only operate on the last bar available.
Can you create a strategy for the PPS study (Person Pivot Study). I want to create a strategy that will back test for buy or sell signals on daily or weekly time frames.
Have you checked our Q&A forum? Someone has already posted a strategy the includes the PPS signals: https://www.hahn-tech.com/ans/trailing-stop-loss-setup-tos-strategy/
Mr. Hahn,
I have watched the above video and was able to create a scan for BBE, thank you immensely. How do create a scan that has two plots and you want to change the condition of one of the plots. I am attempting to scan for stocks that WAD is crossing above an EMA.
declare lower;
plot WAD = AccumDistBuyPr();
plot ZeroLine = 0;
WAD.SetDefaultColor(GetColor(1));
ZeroLine.SetDefaultColor(GetColor(5));
You cannot have a scan that contains too plots. Each scan must include only a single plot. You will probably find the following video very helpful: https://www.hahn-tech.com/thinkorswim-condition-wizard/
Hi Pete,
I have watched your videos and used the knowledge to make some cool strategies so I first wanted to say thank you for all you do. I would like to know how I can define the price at the bar I enter the trade as a variable then use it as a stop to close the trade if the price was to move against me?
Regards,
David
Glad to know you have found value in our videos and are making very good use of that knowledge. Be sure to check the Strategies topic in our Q&A forum. Your question may have already been posted and solved. So be sure to browse through the posts before adding a new question: https://www.hahn-tech.com/ans/cat/strategies/
Hi Pete,
I converted the TTM Squeeze Histogram into a strategy, and the code was exactly as you used in the video. Yet, when i apply the strategy on the chart, i just get one straight line with the entry points annotated from the strategy, but i lose all the other charting studies that I have, such as the candle sticks, bollinger bands, keltner channels. Can you help me with this please.
You will have to post this in the Q&A forum and provide a full view screenshot of your chart. No way to know what you have there until we see it.
Hi, can you kindly share the source code shown in this video
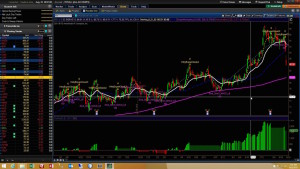
The code shown in the video is a variety of built-in studies, along with a sampling of custom code presented in other videos. There is no source code provided with this video. If you are interested in something in particular you will need to access them by viewing one of the several videos referenced at the start of this video. Please don’t miss the entire point of this video, which is to show you how to convert between scans and strategies.