Custom Watchlist Columns Based on the TTM Squeeze Histogram
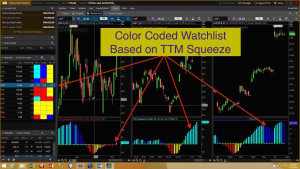
Thinkorswim TTM Squeeze Watchlist
With this tool, just a quick glance is all it takes to see which stocks are trending. This video shows you how to display the TTM Squeeze histogram colors in a custom watchlist column. Add multiple columns to the watchlist, each referencing a different time frame. Easily see which stocks have the TTM Squeeze direction aligned across multiple time frames. Free custom code is included below. Just follow instructions in the video to copy/paste this code and create your very own custom watchlist columns.
No source code is disclosed as the Thinkorswim platform provides access to the plots while keeping the proprietary code out of sight.
Learn More:
Click and drag interface to build custom watchlist columns. No code experience required:
Thinkorswim Condition Wizard Watchlist
DISCLAIMER: I AM NOT A CERTIFIED FINANCIAL ADVISOR AND NOTHING IN THIS VIDEO OR TEXT IS AN ADVERTISEMENT OR RECOMMENDATION TO BUY OR SELL ANY FINANCIAL INSTRUMENT. NOR IS THIS VIDEO OR TEXT INTENDED TO INSTRUCT YOU ON HOW TO MAKE BUY OR SELL DECISIONS USING ANY OF THESE INDICATORS.
*Thinkorswim is a chart analysis platform offered by Charles Schwab: https://www.schwab.com/
Charles Schwab provides financial services including the trading of Stocks, Futures, Options and Forex.
Please be sure to share this page with your friends and colleagues. Leaving comments below is the best way to help make the content of this site even better.
Here is the code used to create your own custom watchlist columns as demonstrated in the video below.
input price = CLOSE;
input length = 20;
input nK = 1.5;
input nBB = 2.0;
input alertLine = 1.0;
def squeezeHistogram = TTM_Squeeze(price, length, nK, nBB, alertLine).Histogram;
plot hist = if squeezeHistogram>= 0 then if squeezeHistogram > squeezeHistogram[1] then 2 else 1 else if squeezeHistogram < squeezeHistogram[1] then -2 else -1;
AssignBackgroundColor(if squeezeHistogram >= 0 then if squeezeHistogram > squeezeHistogram[1] then color.CYAN else color.BLUE else if squeezeHistogram < squeezeHistogram[1] then color.RED else color.YELLOW);
hist.assignvaluecolor(if squeezeHistogram >= 0 then if squeezeHistogram > squeezeHistogram[1] then color.CYAN else color.BLUE else if squeezeHistogram < squeezeHistogram[1] then color.RED else color.YELLOW);
How can I change the code to view the histogram reading inside the matching histogram label?
You can display those values by finding the last line of code and removing it. That last line of code begins with “hist.assignvaluecolor”. However you will find it only displays values from negative 2 to positive 2. These values were intended to enable each column to be sorted, so that colors are grouped together.
Thank you, Pete.
I followed the video, I get the color coded on my watchlist but I don’t get the histogram. Any help?
If the watchlist column is displaying the colors then you have successfully applied the code. I’m not sure why you mentioned the histogram. The histogram would only appear on the chart and not on the watchlist column. Perhaps I don’t understand your question.
Hello Mr. Hahn,
I downloaded the Thinkorswim TTM Squeeze Watchlist. Some of the stocks don’t display color codes. I’m getting message as “Custom Expression Subscription Limit Exceeded”. Please advice about this message. I would appreciate it. Thank you very much.
You will find information about this error in our Q&A Forum. The error message provides all the information you need. Which is that you have exceeded the fixed limit of custom quotes provided by the platform.
Anyway you get the indicator called “Ready, Aim, Fire?”
Yes, you may purchase it from Simpler Trading. This website is not affiliated with Simpler Trading so you will have to contact them directly.
Hello. Thank you so much for your videos. You are AMAZING !!!! I want to ask you what do I have to change to set the squeeze up for diferent time frames. I wd like Daily and 1 hour. Thank you.
Please check the video again. The time frame is set at the very top of the code editor when adding the code to the custom watchlist column. This was shown in the video but you must have missed it.
First, Thanks for the scan. A suggestion for another scan…how bout a scan that shows when the histogram changes from red to yellow. That way hopefully catch a bottom and than get in early. I’m off to donate. Really appreciate your free help.
Check the forum. There are a very large number of variations of this already published there. FYI, we do not accept “donations”. Hahn-Tech is a for-profit company and we are not able to accept donations. But your “Voluntary Contribution” is greatly appreciated.
Just a thought … When a security is highlighted in the list, rather that showing a number (-1, -2 …) might it be able to show Y, LB, DB, R … for … (Yellow, LightBlue, DarkBlue, Red)
You can do that but then you will not be able to sort by that column to view stocks grouped by color. Text values do not sort correctly in a custom watchlist column.
Any idea why the this wouldnt update in the watchlist?
I scalp, so I have mine setup for 5 min and 1 min squeeze (with color columns from the earlier vid you provided) BUT today I had one stock that was in a squeeze for well over 30mins via a 5 min chart that was not showing up red on this, and same at the 1 min
I had to go into the edit feature and simply save them again making NO changes at all to the code for them to display the correct status of the stock I was watching.
Sorry but I really have no idea why that would happen under normal operation. I have seen it take 3-5 minutes for custom columns to updated under normal circumstances. And I have seen much longer delays when they were having problems. But I haven’t seen any problems in the last several weeks. I suggest you contact TD Ameritrade support if this continues.