| ♥ 0 |
A viewer asks: How can I create a lower chart study similar to what you provided in the following video: https://www.hahn-tech.com/thinkorswim-scan-ttm-squeeze-histogram/ Except that I would like to add another rule for the color of the squeeze dot to be green when the histogram crosses above the zero line?
Marked as spam
Asked on October 31, 2020 6:42 pm
451 views
|
|
Private answer
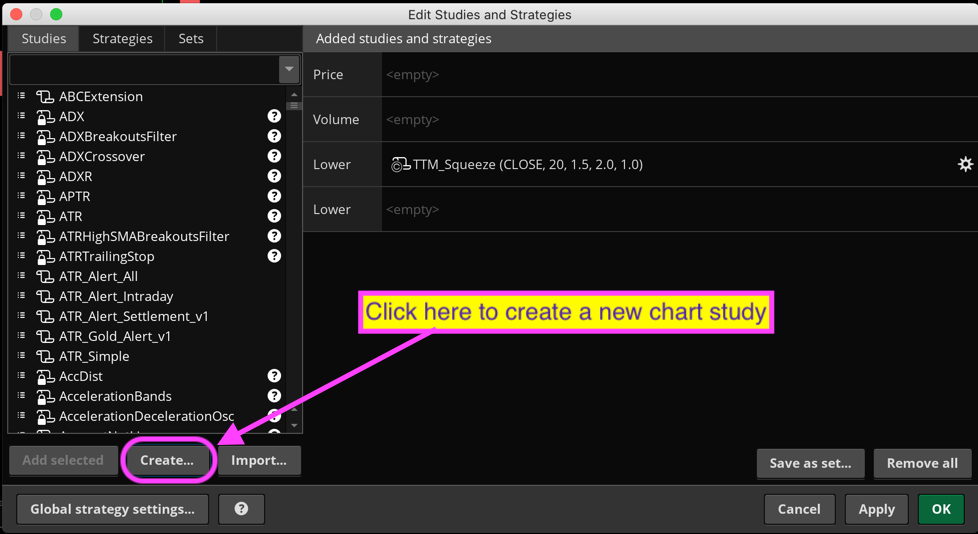
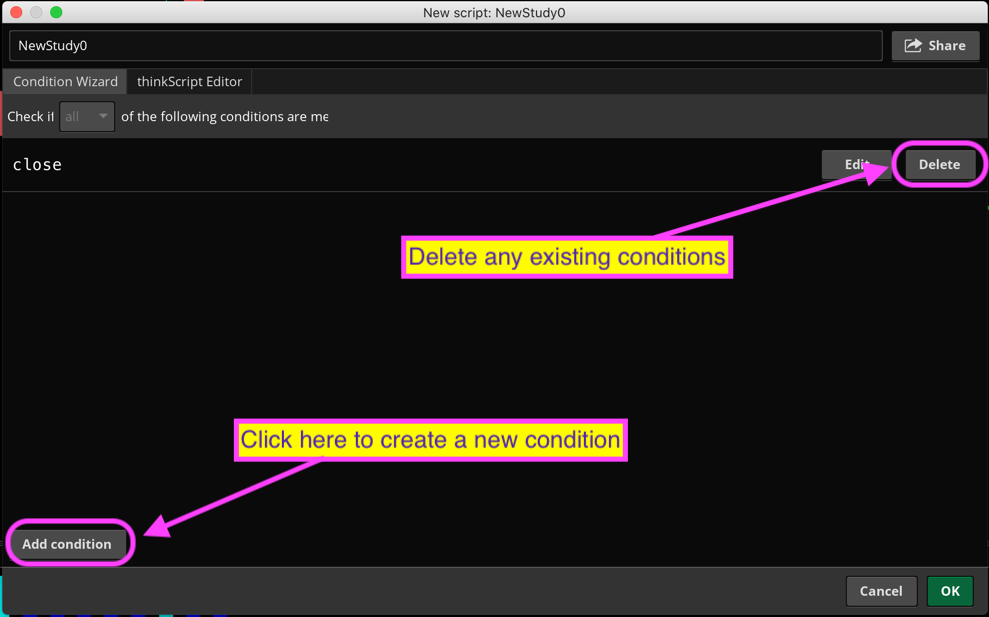
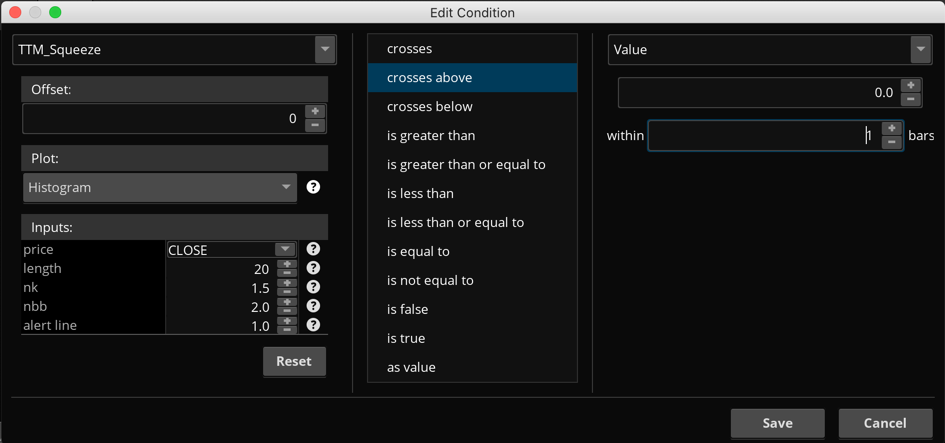
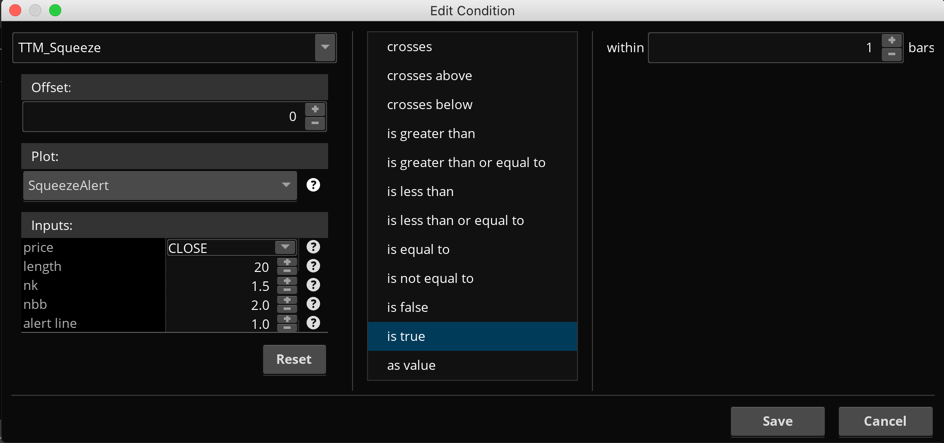
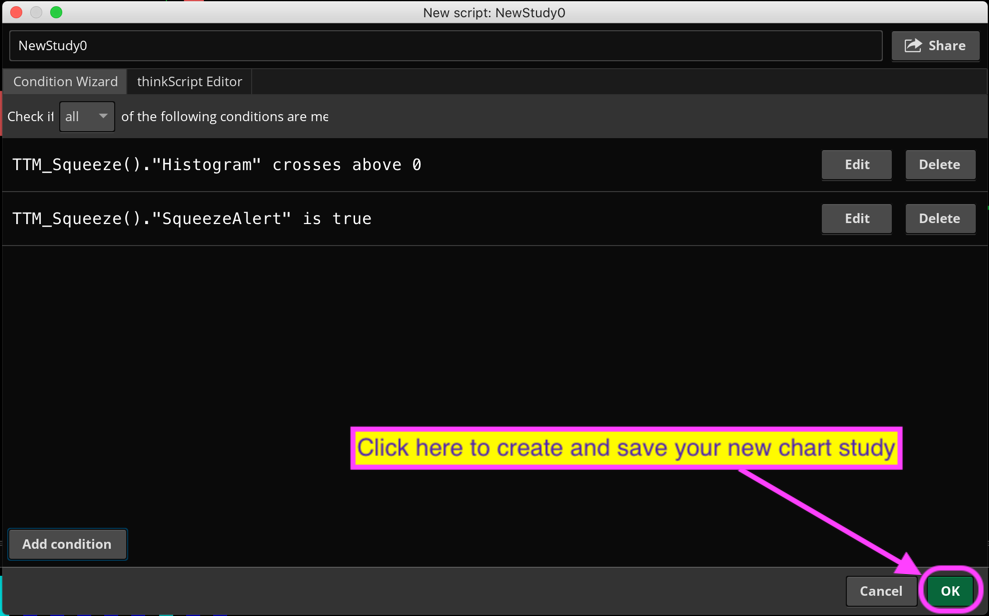
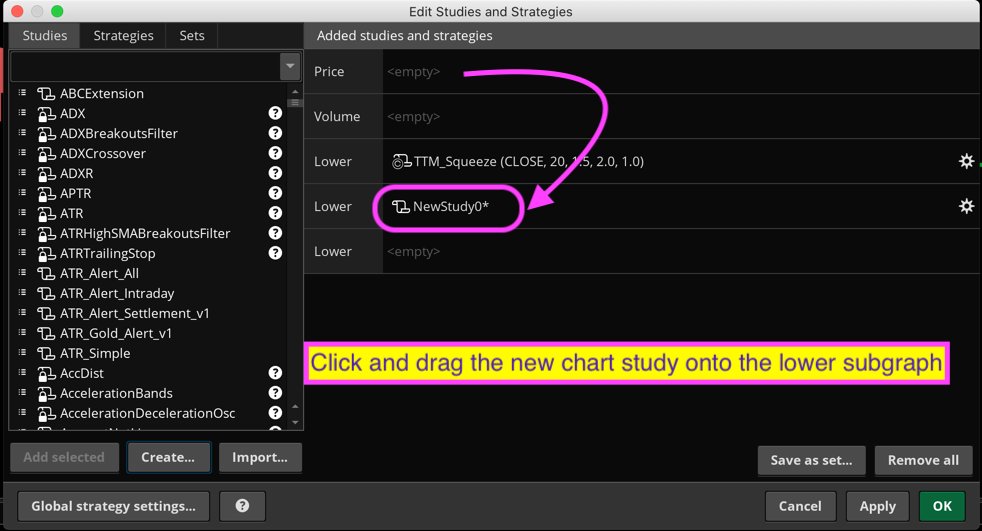
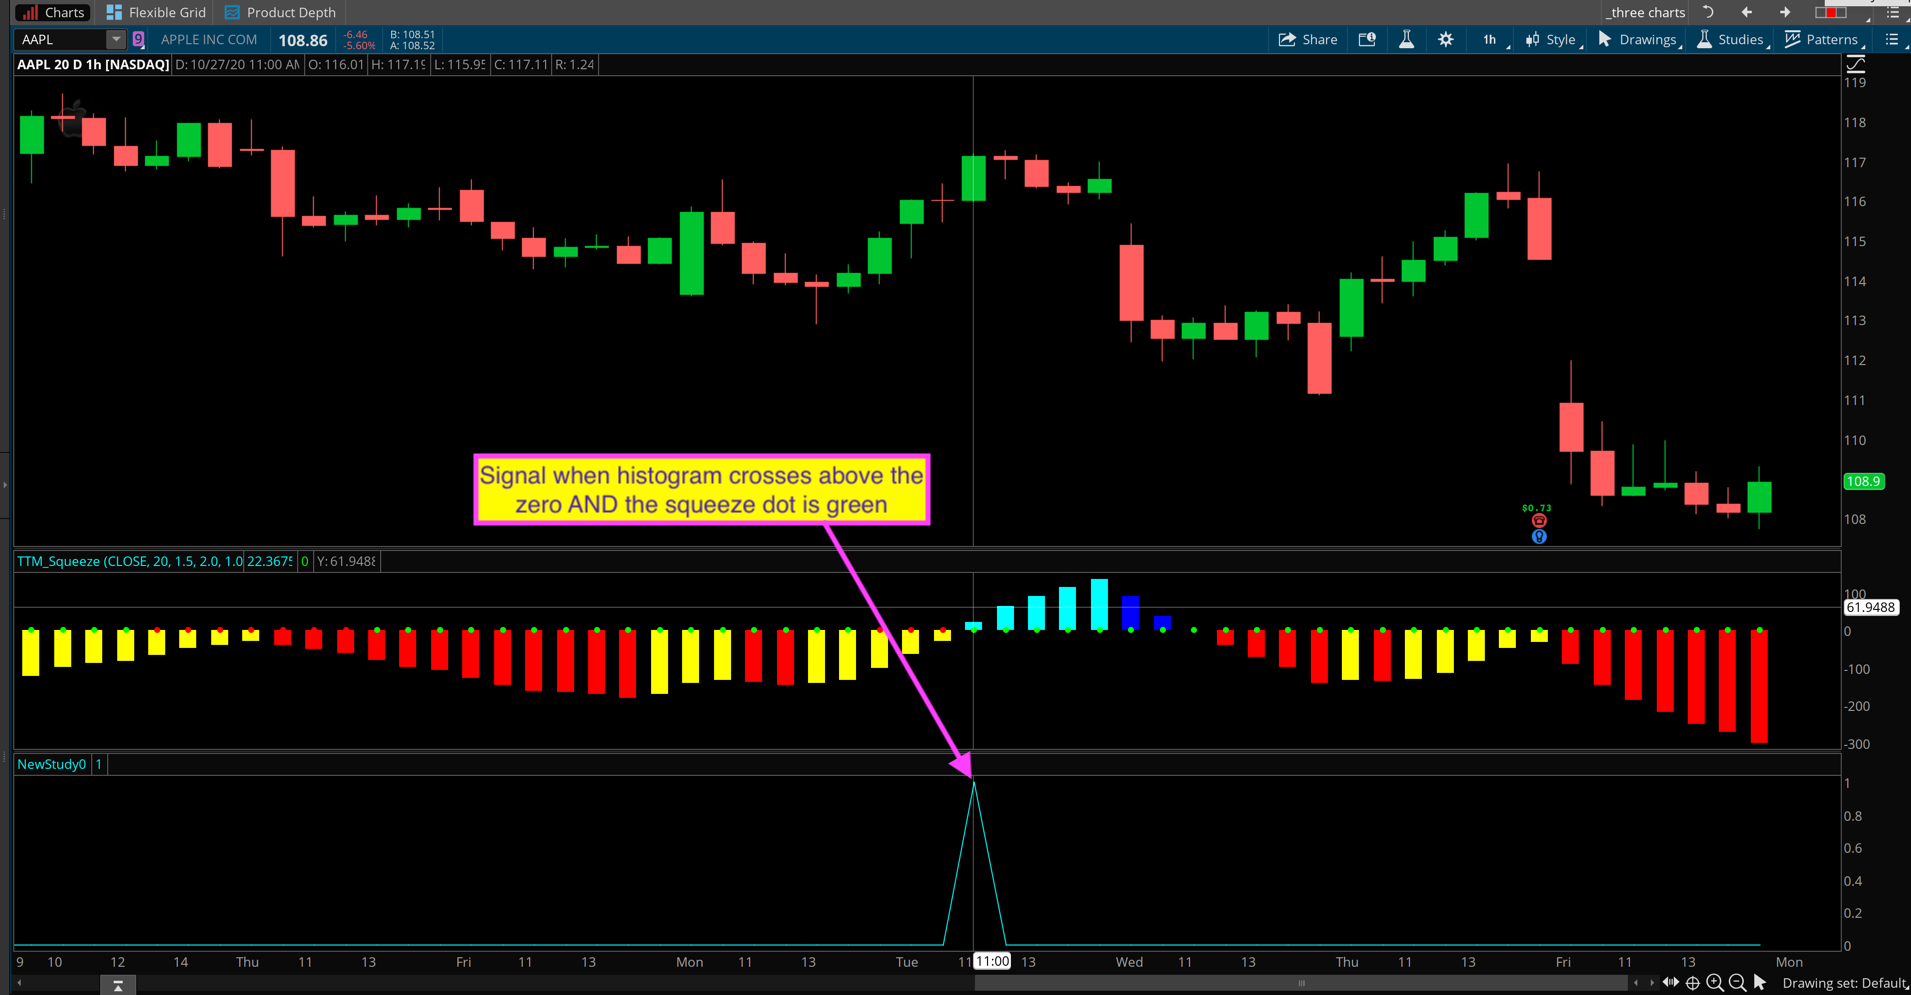
We can build this using nothing more than the Condition Wizard. In the following video I demonstrate how to use the Condition Wizard to build a custom chart study that plots the signals on the lower subgraph. https://www.hahn-tech.com/thinkorswim-condition-wizard-watchlist/ Just fast forward to the 11:38 mark to jump straight to the section where I show how to create one of these lower chart studies using nothing more than the Condition Wizard. Additionally, I also provided instructions on how to build this as an alert/scan. Check the following post for details: https://www.hahn-tech.com/ans/ttm-squeeze-green-dot-alert/ If you view that section of the video from the first link, you can follow the instructions provided on that previous post and you can build this as a chart study. But I will save you the effort of trying to put all the pieces together and provide a full set of instructions on how to build this using nothing more than your mouse/trackpad. The screenshots below show each step in the process:
The final screenshot in the series below shows the result. Attachments:
Marked as spam
Answered on October 31, 2020 7:05 pm
|