Combining the Historical and Implied Volatility into a Single Study
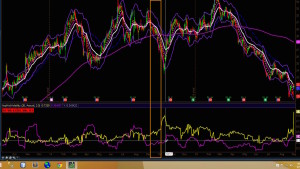
Thinkorswim Historical Implied Volatility
Free indicator included, linked below. Plot both the Historical and Implied Volatility together in the same subgraph of a stock chart. Clearly see where crossovers occur. Use this free indicator in a custom scan. Step-by-step instructions in the video show how to run three different kinds of scans from this one indicator. One of the three scans can be used as a pre-earnings scan. This can help you locate stocks where implied volatility is spiking ahead of an expected event, such as earnings, pending court settlements, or pending drug trials.
Use the link below to download this free indicator to your computer. For instructions on how to install it, look for the video titled “Thinkorswim Display Name of Saved Chart“. The instructions begin at the 4:28 mark.
Here is a link to download this free indicator:
Lean More:
Would you like to learn how to master the custom scan tools on Thinkorswim?
Click here: Thinkorswim Scans Beginner to Advanced
Learn how to build custom scans without writing any code: Thinkorswim Condition Wizard
DISCLAIMER: I AM NOT A CERTIFIED FINANCIAL ADVISOR AND NOTHING IN THIS VIDEO OR TEXT IS AN ADVERTISEMENT OR RECOMMENDATION TO BUY OR SELL ANY FINANCIAL INSTRUMENT. NOR IS THIS VIDEO OR TEXT INTENDED TO INSTRUCT YOU ON HOW TO MAKE BUY OR SELL DECISIONS USING ANY OF THESE INDICATORS.
*Thinkorswim is a chart analysis platform offered by TD Ameritrade: www.tdameritrade.com
TD Ameritrade provides financial services including the trading of Stocks, Futures, Options and Forex.
Please be sure to share this page with your friends and colleagues. Leaving comments below is the best way to help make the content of this site even better.
Watch the video, Thinkorswim Historical Implied Volatility below:
Here is an updated version of the chart study which has already been configured to work as a scan. Seems that there are some additional steps required by the current version of Thinkorswim which were not required at the time this video was published.
# This source code is subject to the terms of the Mozilla Public License 2.0 at https://mozilla.org/MPL/2.0/
# Author: Pete Hahn (Hahn-Tech, LLC)
# tutorial video: https://www.hahn-tech.com/thinkorswim-historical-implied-volatility/

declare lower;
declare hide_on_intraday;

input length = 20;
input basis = {default Annual, Monthly, Weekly, Daily};
input volatilitySpreadMultiplier = 2.0;

def ap = getAggregationPeriod();

Assert(ap >= AggregationPeriod.MIN, "Study can only be calculated for time-aggregated charts: " + ap);

def barsPerDay = (RegularTradingEnd(getYyyyMmDd()) - RegularTradingStart(getYyyyMmDd())) / ap;
def barsPerYear =
    if ap > AggregationPeriod.WEEK then 12
    else if ap == AggregationPeriod.WEEK then 52
    else if ap >= AggregationPeriod.DAY then 252 * AggregationPeriod.DAY / ap
    else 252 * barsPerDay;

def basisCoeff;
switch (basis) {
    case Annual:
        basisCoeff = 1;
    case Monthly:
        basisCoeff = 12;
    case Weekly:
        basisCoeff = 52;
    case Daily:
        basisCoeff = 252;
}

def clLog = log(close / close[1]);

def wklyPrctMove = round( ( highest(high, 5) - lowest(low, 5) ) / lowest(low,5), 3) * 100;

def mthlyPrctMove = round( ( highest(high, 21) - lowest(low,21) ) / lowest(low,21), 3) * 100;

def impVol = IMP_VOLATILITY();
def hv = stdev(clLog, length) * Sqrt(barsPerYear / basisCoeff * length / (length - 1));

# to use in scan mode, place '#' in front of these two plot statements
def impVolLine = impVol;
def histVolLine = hv ;

def doubleVolSpread = impVol > hv * volatilitySpreadMultiplier;
def signal = doubleVolSpread and highest(doubleVolSpread[1], 10) < 1;
def check = impVol != Double.NEGATIVE_INFINITY;
def check2 = impVol != Double.POSITIVE_INFINITY;

# use ONE of these three plot statements in scan mode. After commenting out
# the two plot statments above, select one of the three below and remove the
# '#' symbol from in front of the plot statment

# use this to find stocks where Implied Vol has reached two times Hist Vol
plot scan = if signal and check and check2 then 1 else Double.NaN;

# use this to find stocks where Implied Vol has crossed above Hist Vol
#plot scan = impVol > hv and impVol[1] < hv[1] and check and check2;

# use this to find stocks where Implied Vol has crossed below Hist Vol
#plot scan = impVol < hv and impVol[1] > hv[1] and check and check2;
hi, i have your script in and everything seem ok except it doesnt display on the chart.
Check that your chart is set to a daily time frame. This indicator is set to hide when the chart is set to daily time frame. The values it computes are only valid when applied to the daily charts.
Hi Pete. You mentioned in one video that you took a course from John Carter. Was it an option course? Would you recommend it?
I haven’t actually “taken a course”. I had a membership to his live trading room, back when he was running Trade The Markets along with Hubert Senters and Robert Hoffman. John Carter is an exceptional teacher and I believe that traders of all skill levels could benefit from his teaching. He is also an exceptionally good salesman. So be on guard for that. He has tons of great things for sale, not saying anything against that. Just keep your guard up and don’t buy anything on “spur of the moment” because it seems like a “once in a lifetime opportunity”.
HI
Is your imphistvolatility study up to date?? I got it to show up in the edit studies and strategies but i cant get it to show up in any chart.
Would you happen to know if this study comes with any other charting program on the market? This TD Ameritrade charting is probably the most diffilcult and time consuming program ive ever used.
Yes, the chart study is up to date. If you follow the instructions for importing chart studies it should work fine. The chart study does not display on intraday time frames. You must set your chart to daily time frame or higher.
Hi Pete,
Thank you so much for making this custom indicator.
When I download the file I cannot open it, it says it’s a “.ts” file and it’s only 2.25KB, is this the right file ?
The following post in our FAQ’s should set you straight: https://www.hahn-tech.com/ans/how-to-download-and-import-study-ts-files-into-thinkorswim/
Thank you so much for your prompt response, much appreciated.
Hi Pete, I truly appreciate all your generous time and hard work putting together these valuable videos. For the people who are getting AddLabel errors where it doesn’t let you push OK to save; all you have to do is place a # in front of the 2 lines that says AddLabel. The 2 lines in my script are lines 31 & 34. That’s it, then it’ll work.
Thanks for that. I thought I explained that in the video. Perhaps I missed it?
No worries at all Pete. Your videos are always spot on and user friendly. It also contain useful details. You make it so easy to follow instructions. When I replayed your video again just now, I didn’t see a # in front of line 34 which I could see, but you may have placed it later on. I haven’t seen an error in the bottom of your script either. Maybe the scrip knows it’s you the expert and didn’t want to give you an error haha. However, thanks to you, I learned to place a # in front of a command to inactivate it and it worked.
Hi, thanks for all these work of yours much appreciate, however my TOS Script Editor insist “Addladel” line 35, 38 is not allowed please help.
Make sure you have not skipped any part of the video. If you are applying this code to a Study Filter of a scan there are certain modifications required. That’s why we don’t publish a list of free scripts. Each script requires the instructions in the video to make them work and understand what they do.
When attempting to create the scan get message “AdLabel not allowed in this context”.
So remove that line of code. It only plots a label on the chart and is not valid for scans.
This scan does not work. Something is wrong with the code
I just tested it. Works fine. Nothing wrong. You have some details about what your screen is telling you?
When I put in the code to scan as per the video the OK button will not light up so it wont let me scan. I have tried twice just like you show in the video. I do notice that the bottom where you choose which scan is not in yellow
Are there any errors displayed?