This custom scan is no longer available. It has been replaced with a new premium version which you can view on the following webpage:
Link: https://www.hahn-tech.com/thinkorswim-volume-profile-v4/
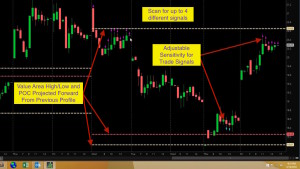
Thinkorswim Scan Volume Profile
Are you a fan of Volume Profile? This video shows you how to run a custom scan using Volume Profile to identify 4 separate signals commonly used by Profile traders. Both long a short signals are included. This scan projects the Volume Profile from the prior period into the current one. It then uses the Value Area to locate tradable opportunities commonly used by Profile traders. Parameters are included to adjust the sensitivity and duration used to identify potential entries.
Free custom scan code included. Be sure to watch the entire video to learn how to use this scan. the code for the custom scan can be downloaded here: Scan_VolProfile.txt
There is a premium chart study available for this scan as well and you will find it listed among our premium trading tools: Thinkorswim Premium Trading Tools
Lean More:
Would you like to learn how to master the custom scan tools on Thinkorswim?
Click here: Thinkorswim Scans Beginner to Advanced
Learn how to build custom scans without writing any code: Thinkorswim Condition Wizard
DISCLAIMER: I AM NOT A CERTIFIED FINANCIAL ADVISOR AND NOTHING IN THIS VIDEO OR TEXT IS AN ADVERTISEMENT OR RECOMMENDATION TO BUY OR SELL ANY FINANCIAL INSTRUMENT. NOR IS THIS VIDEO OR TEXT INTENDED TO INSTRUCT YOU ON HOW TO MAKE BUY OR SELL DECISIONS USING ANY OF THESE INDICATORS.
*Thinkorswim is a chart analysis platform offered by Charles Schwab: https://www.schwab.com/
Charles Schwab provides financial services including the trading of Stocks, Futures, Options and Forex.
Please be sure to share this page with your friends and colleagues. Leaving comments below is the best way to help make the content of this site even better.
Hello Mr. Hahn, Thank you for the great work that you do. Your videos and scripts are awesome, i love you videos, you’re truly the Bob Ross of thinkscript!
I was trying to download the script to Thinkorswim Volume Profile but it looks like the download link provided is pointing to another script : https://www.hahn-tech.com/download1hist2implied/
Please let me know if this is correct as the link provided on this page, https://www.hahn-tech.com/thinkorswim-scan-volume-profile/, takes me to ImpHistVolatilitySTUDY.ts instead. Thank you again.
Thanks for taking the time to request assistance. When I examine the page you referenced, I do not find any download links at all within the video description. When I use the link provided directly within the video itself, it directs to the correct download page, here: https://www.hahn-tech.com/download1scan2volume3profile/
But since the webpage you referenced does not include the download link I decided to update that page to include a link to the download page.
Good evening Mr. Hahn.
I’m having trouble with the download link for the volume profile scan. Do you mind checking it on your end to see if there is an issue with link to download vol prof scan?
Thank you
Ty
I just tested it and it’s working fine. I recently updated the links on the website so you may need to clear the cache on your browser. Or use a browser you have not used to access our site in the past.
Have you found a solution for this scan? The criteria all comes out with the exact same result.
I have no idea what you mean by “found a solution”. The scan works just the same today as it always has.
Hi Pete, I’ve been searching far and wide for a volume profile scan and stumbled upon your video! Unfortunately, I’m not able to get any results in scanning my watch list of 500 stocks in TOS. I’ve changed parameters for week and month and tried different plot scans following your video. Nothing comes back. Any ideas what I might be doing wrong?
Keep up the great work!
Thanks,
Vince
There are many moving pieces involved and it’s probably not even possible to describe them all without a screenshot. I suggest you post this question in the Q&A Forum where you can provide a screenshot showing how you have setup your scan.
HI Pete,
First of all, I want to thank you for the awesome videos, scans, etc., that you provide. They are excellent!!!
I have downloaded the Volume Profile scan and would like to know how much does the study costs.
Kind regards,
Otto
I’m glad you find our videos helpful. Thanks for taking the time to express your appreciation. All of our premium chart studies are listed on the following webpage: https://www.hahn-tech.com/premium-chart-indicators/ You will find the order forms on that page will always display the most current price. Thanks!
hi Pete…saw this video and loved it but am having an error with the scan. copied and pasted but receive Error: Script execution timeout message when running the scan?
You will need to limit the universe of stocks included in the scan. The following video explains how to apply a top level filter and additional stock filters to reduce the number of ticker symbols to only those you want to actually trade: https://www.hahn-tech.com/thinkorswim-scans-beginner-to-advanced/