Custom Scan Based on Ichimoku
Thinkorswim Scan Ichimoku
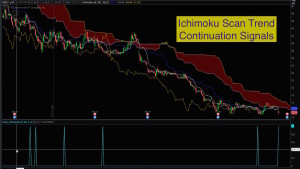
Free custom code linked below. Based on the Ichimoku study, this code will let you scan for Cloud Breakouts as well as Trend Continuation signals. The signals are crafted to mirror the techniques taught by Hubert Senters (videos linked below). It will scan for longs or shorts. Each scan signal has two versions. One captures the raw signal and the second adds a filter using the Chikou (Lagging Line) to confirm the bullish or bearish direction. This provides a total of 8 different signals you can use for scans.
Here is a link to the custom code for running the scans in Thinkorswim:
Here is the link to video instruction by Hubert Senters:
Ichimoku Trading Strategies For Finding Better Trades by Hubert Senters
Lean More:
Would you like to learn how to master the custom scan tools on Thinkorswim?
Click here: Thinkorswim Scans Beginner to Advanced
Learn how to build custom scans without writing any code: Thinkorswim Condition Wizard
DISCLAIMER: I AM NOT A CERTIFIED FINANCIAL ADVISOR AND NOTHING IN THIS VIDEO OR TEXT IS AN ADVERTISEMENT OR RECOMMENDATION TO BUY OR SELL ANY FINANCIAL INSTRUMENT. NOR IS THIS VIDEO OR TEXT INTENDED TO INSTRUCT YOU ON HOW TO MAKE BUY OR SELL DECISIONS USING ANY OF THESE INDICATORS.
*Thinkorswim is a chart analysis platform offered by TD Ameritrade: www.tdameritrade.com
TD Ameritrade provides financial services including the trading of Stocks, Futures, Options and Forex.
Please be sure to share this page with your friends and colleagues. Leaving comments below is the best way to help make the content of this site even better.
Can this work for Day Trading or best with Swing
You get to pick whatever time frame you want. If you view the instructions provided by Hubert Senters you will find he covers both day trading and swing trading with this indicator.
Thanks for the great tutorial and code. I’ve been looking at the Ichimoku for a while and read several references including a very interesting paper validating one of the trade signals (http://www.ftaa.org.cn/Files/2016.pdf#page=20). I hope you can help me better understand the code though in two spots.
1) For laggingLineOverCloud (and undercloud) you compare the Chikou (which is a period in the past) to the Span A or Span B which I gather is today. Shouldn’t the Chikou be compared to Span A at the same time period in the past as the Chikou? Or am I misinterpreting the comparison being made?
2) Why does CloseCloudDiff only use Span B in the calculation? As currently written, wouldn’t UnderCloud or OverCloud potentially produce a signal in the cloud? UnderCloud actually in the cloud in a Bearish Cloud and OverCloud in the cloud in a Bullish Cloud?
Thanks for the clarification
Did you view the video I linked from Hubert Senters? Everything in this code was taken directly from his specifications and his method of teaching the Ichimoku. His video was linked in the description of my video. None of this came from my own ideas or concepts of how this should be traded.
I did. My question is not about the trade but about the code you provided to replicate those signals. I do not think the code accurately reflects the signals that are mentioned. Around the 21 minute mark he talks about the bearish strategy of price crossing the cloud with the lagging line below the cloud. He also explains how you will some of the up and downside but this is part of the process. The lagging line location compared to the cloud is compared to the cloud at the location of the lagging line which is a time period behind today. This brings me back to my original questions. It appears to me that your code is not comparing the Chikou to the right time point on the Span. And I reask my questions.
If the code is correct, I apologize but would appreciate an explanation of how the code replicates the signals. Happy to talk off line if you would like to email me.
I think you will have more success reading the code if you start from the bottom and read backward. For the bullish break out with confirmation you find there are two conditions. signalBreakAboveCloud and signalBullishConfirmation. When you follow the second one further back in the code you find it gets its value from this: laggingLineOverCloud[kijun_period]. So this is where the code is looking backward (26 bars) to see if the lagging line is above the cloud (26 bars back).
To see this graphically, plot this scan as a lower study, turn off all the plots and change this line from a def to a plot:
def laggingLineOverCloud = (Chikou > “Span A” and bullishCloud) or (Chikou > “Span B” and bearishCloud);
You will find that it correctly tracks when the lagging line is above the cloud, 26 bars back from the current bar.
This line of code is how we check the true/false condition of that variable, looking backward 26 bars:
def signalBullishConfirmation = laggingLineOverCloud[kijun_period];
In case you want to see that graphically, simply change that statement from a def to a plot. You will see it replicates laggingLineOverCloud exactly 26 bars to the right.
If this still doesn’t clear things up then post this in the Q&A forum were we can cover things in more detail with screenshots to visualize everything. But to answer your question. Yes, the code is behaving exactly as Hubert Senters defined it.
Pete, just wanted to thank you for all your fantastic work and patience. What an amazing resource you’ve created. Learning from your TOS posts and also looking forward as you get into TS a bit more
Thanks, tried before, didn’t help
I use daily time frame and I’ll try your suggestion’
Thanks
That suggestion was only valid if using intraday time frames. Not Daily. If you are having issues you cannot resolve then post a request in our Q&A forum. Be sure to include a screenshot showing a scan result that is inaccurate.
I tried several times to install the cloud scanners with your instructions and videos and found that they just don’t work properly
Details? Are you using intraday time frames or daily? If intraday, did you go to your chart settings and turn off the setting “start aggregation at market open”? Would love to assist you but I need details.
I have the scan loaded and available on ToS but the Scan button stays inactive. Is there something I can do? Thank you.
“The scan button says inactive”. Sorry, never saw that before. Not sure what’s wrong.
you can not use in demo mode if that helps
hi pete, i am a big fan of the ichimoku cloud. i am very interested in using the scan but i am having trouble importing it into TOS. when i down loaded it, it did not have .ts on the end so i added it. when i hit import and go to down loads it does not pop up. can you please help me with this. thanks
From our FAQ’s. See if this helps: https://www.hahn-tech.com/ans/how-to-download-and-import-study-ts-files-into-thinkorswim/
Thank you for your quick response. I have followed the steps from faq. When i down load the scan it does not have .ts, is it ok to rename it with .ts. on tos enter edit studies, ckick import, go to downloads and it is not recognized. I type in the file name and get a error message. If you have any further suggestions it would ba appropriated.
Thanks
Try doing this without changing the file extension. Your computer may be set to not display the file extension. Which would mean the .ts is already there and by “adding” it you are breaking it.
Thank you. That was it