Basic Overview of Using Strategies in Thinkorswim
Thinkorswim Strategy Guide
So you have this trading strategy but you have no idea how it performs. Wouldn’t you love to be able to have Thinkorswim automatically test your strategy for you? And wouldn’t it be great if it let you export the trade details so you could analyze them in a spreadsheet? Yeah, it can do that. This video, “Thinkorswim Strategy Guide”, shows you how. The video even includes a link to download a custom strategy that can both long and short entries. The link is embedded within the video so be sure to watch for it. This amazing feature in Thinkorswim is explained step-by-step. If you want to see more videos on this topic just be sure to like the video and leave some comments below.
The following link will take you to the page where you can download the strategy featured in this video:
Strat_PivotRev_SlowDRevSTRATEGY.ts
For Advanced Users Only:
Take this knowledge to the next level and learn how to automate your trades on Thinkorswim
Thinkorswim Automated Round-Trip Trades
DISCLAIMER: I AM NOT A CERTIFIED FINANCIAL ADVISOR AND NOTHING IN THIS VIDEO OR TEXT IS AN ADVERTISEMENT OR RECOMMENDATION TO BUY OR SELL ANY FINANCIAL INSTRUMENT. NOR IS THIS VIDEO OR TEXT INTENDED TO INSTRUCT YOU ON HOW TO MAKE BUY OR SELL DECISIONS USING ANY OF THESE INDICATORS.
*Thinkorswim is a chart analysis platform offered by Charles Schwab: https://www.schwab.com/
Charles Schwab provides financial services including the trading of Stocks, Futures, Options and Forex.
Please be sure to share this page with your friends and colleagues. Leaving comments below is the best way to help make the content of this site even better.
Watch the video, Thinkorswim Strategy Guide below:
A viewer requested the lower study version of a strategy demonstrated in this video. The time stamp where this appears is around 11:22 and the study is called “Strat_PivotRev_TrailSqz”. I decided to make this available to everyone right here at the end of this post. The code is displayed below. Just select the text of the code and copy it to your clipboard. Then in the TOS platform go to the edit studies window and click the ‘New” button in the lower left. You can name the study however you like, then paste this code into that window, being sure to first clear away any text that shows up by default. Hope it helps. If you any further questions just leave a comment in the box below.
declare lower;
input direction = {default "Long", "Short"};
input tradeSize = 100;
input KPeriod = 10;
input DPeriod = 10;
input priceH = high;
input priceL = low;
input priceC = close;
input averageType = AverageType.SIMPLE;
def SlowD = reference StochasticFull(80,20,KPeriod,DPeriod,priceH,priceL,priceC,3,averageType).FullD;
def pivotLow = low > low[1] and low[1] < low[2] and low[2] < low[3];
def pivotHigh = high < high[1] and high[1] > high[2];
plot pivotLowReversal = ( pivotLow and close > high[1] ) or ( pivotLow[1] and close > high[2] and low > low[2] and high[1] < high[2] );
plot exitLong = SlowD < SlowD[1] and SlowD[1] < SlowD[2] and highest(pivotLowReversal[0],2) == 0;
def entry;
def exit;
switch (direction) {
case "Long":
entry = pivotLowReversal;
exit = exitLong;
case "Short":
entry = no;
exit = no;
};
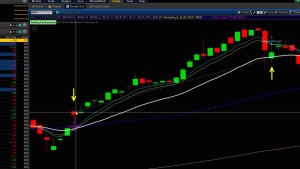
Hi Pete, I went thru your video and really like it. Can you please let me know how you configured the MovingAvg_8_20_50. This component wasn’t present when I imported the file listed below and I’m uncertain how to create it myself. Strat_PivotRev_SlowDRevSTRATEGY.ts
Regards
Brian Thomas
Those moving averages were not included as an element in the chart strategy. They just happened to be on my charts when I recorded the video. They are not required.
thank you so much for the video it really help me with my trade can you tell me where do i download (Strat_PivotRev_Trailsqz) please
Just scroll this webpage up a bit further. The code is presented right here on this very webpage. It is located immediately above your comment and below the video.
Thank You so much
Pete,
Just found this with video but for some reason doesn’t show anything on chart. Please advise what I’m doing wrong?
Thank you in advance!
Your comment was edited to remove the code you included. The comments section of a video is not the place to post code and request assistance. I suggest you spend some time browsing existing solutions in the Q&A Forum.
Hahn
I have a quick question. Is there a way to limit a scan to a list of securities or watch list. Say for example I want to limit my scan just to AAPL and C or Watchlist “A”. My list is not limited to any category like DJI or S&P.
Thanks in advance for you help.
Joe
This question is totally not within the context of the video you are commenting on. You probably meant to post this comment on the following video instead: https://www.hahn-tech.com/thinkorswim-scans-beginner-to-advanced/
Which is where you will find the answer to your question.
Hi Pete, thanks for putting these wealth of knowledge. For the life of me I couldn’t download this “Long Haul” Strategy. So I took the screen shot and converted and verified the code form your video. But I am getting error on entrypoint() and also in IsNaN.
Please provide me the link so I can download it or tell me what to do. I don’t know your google drive link either. thanks again.
The following post in our FAQ section should clear up the problem you are having. The file is a study file and is cannot be opened to view it’s contents for copy/paste. The file must be saved to your hard drive and imported into Thinkorswim.
I am a newbie, I am trying for 2 days without success. I humbly request if you can give me the link to download, I will really appreciate it.
That is the only link to download. Every video I publish provides the code in this format. You will need to learn how to work with these types of files if you want to benefit from all of the free content I provide.
Love your videos. They are well done and very informative.
I have written a strategy (this is the first strategy I have written. I have written a lot of studies (thanks to you). I have done my strategy’s in Excel. This is a cool alternative). I believe that the strategy is properly set up to only buy when buy conditions are met and sell only when sell conditions are met.
I am basically using your ADDORDER statements
AddOrder(OrderType.BUY_AUTO, GreenDown, open[-1],
tradeSize, Color.PINK, Color.PINK,
“GreenDown @ ” +open[-1]);
AddOrder(OrderType.SELL_AUTO, RedUp, open[-1],
tradeSize, Color.white, Color.white,
“RedUp @ ” +open[-1]);
This is what happens when I run the study.
A buy is initiated when the first buy or sell condition is met.
This will run until the next buy or sell condition is met.
At the same time, an inverse by is initiated.
When the next condition is met it inverts the order again.
so on an so forth until, the chart ends.
FloatingPL shows no time when it is flat (an indication that no position has been taken).
The chart is showing alternating blue and red dashed lines between the trades.
My buy or sell indicator sometimes indicates a buy/sell when it is already in the market. Could this be the problem?
There are places where there is clean buy to sell (no intervening indicators). And it still has the same problem.
What is wrong?
Sorry but there is very little assistance I can provide for a question of this complexity. That’s why we have a Q&A Forum. I suggest you search the Q&A Forum for examples and see if that clears up your issue. For now the only detail I can provide is your order are set to “BUY_AUTO” and “SELL_AUTO” and this would cause exactly what you have described. There does not appear to be anything wrong. You probably just need to change the order types.
Hi Pete: I have developed a number of strategies in TOS, using the “Create Scan Query” and then have the program convert each Scan into ThinkScript, which then gives me Buy & Sell signals for each equity chart,
ie., In ThinkScript: To BUY: “MACD().”Value” is greater than MACD().”Value” from 1 bars ago
To SELL: “MACD().”Value” is less than MACD().”Value” from 1 bars ago”
Is there a simple way to convert those strategies to get a Floating PL graph without writing the horrendous codes?
Indeed there is. I published some templates built for just this purpose and the following video provides those templates and demonstrates how to use them: https://www.hahn-tech.com/thinkorswim-autotrade-almost/
Hi Pete,
Appreciate your video. Great job !!
If I want to develop my own strategies, what scripting language can be used? I am using C# to develop strategies now. Can I load those into TOS Strategies? What other languages can be loaded into TOS Strategies?
Appreciate your help.
Phil
At this time not other languages are supported. Since you are already writing strategies in C# I suggest you move to a platform that supports a real programming language. Trade Station, Sierra Chart or NinjaTrader. Thinkorswim only supports a very basic scripting language.