Custom Watchlist Columns Based on the TTM Squeeze Histogram
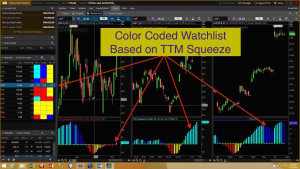
Thinkorswim TTM Squeeze Watchlist
With this tool, just a quick glance is all it takes to see which stocks are trending. This video shows you how to display the TTM Squeeze histogram colors in a custom watchlist column. Add multiple columns to the watchlist, each referencing a different time frame. Easily see which stocks have the TTM Squeeze direction aligned across multiple time frames. Free custom code is included below. Just follow instructions in the video to copy/paste this code and create your very own custom watchlist columns.
No source code is disclosed as the Thinkorswim platform provides access to the plots while keeping the proprietary code out of sight.
Learn More:
Click and drag interface to build custom watchlist columns. No code experience required:
Thinkorswim Condition Wizard Watchlist
DISCLAIMER: I AM NOT A CERTIFIED FINANCIAL ADVISOR AND NOTHING IN THIS VIDEO OR TEXT IS AN ADVERTISEMENT OR RECOMMENDATION TO BUY OR SELL ANY FINANCIAL INSTRUMENT. NOR IS THIS VIDEO OR TEXT INTENDED TO INSTRUCT YOU ON HOW TO MAKE BUY OR SELL DECISIONS USING ANY OF THESE INDICATORS.
*Thinkorswim is a chart analysis platform offered by Charles Schwab: https://www.schwab.com/
Charles Schwab provides financial services including the trading of Stocks, Futures, Options and Forex.
Please be sure to share this page with your friends and colleagues. Leaving comments below is the best way to help make the content of this site even better.
Here is the code used to create your own custom watchlist columns as demonstrated in the video below.
input price = CLOSE;
input length = 20;
input nK = 1.5;
input nBB = 2.0;
input alertLine = 1.0;
def squeezeHistogram = TTM_Squeeze(price, length, nK, nBB, alertLine).Histogram;
plot hist = if squeezeHistogram>= 0 then if squeezeHistogram > squeezeHistogram[1] then 2 else 1 else if squeezeHistogram < squeezeHistogram[1] then -2 else -1;
AssignBackgroundColor(if squeezeHistogram >= 0 then if squeezeHistogram > squeezeHistogram[1] then color.CYAN else color.BLUE else if squeezeHistogram < squeezeHistogram[1] then color.RED else color.YELLOW);
hist.assignvaluecolor(if squeezeHistogram >= 0 then if squeezeHistogram > squeezeHistogram[1] then color.CYAN else color.BLUE else if squeezeHistogram < squeezeHistogram[1] then color.RED else color.YELLOW);
This color coding on watchlist is very useful. Can you also provide coding for MACD Histogram colors like you did for TTM Histogram? I tried to code it for MACD histogram without success. I am willing to pay for this service. Note: i have bought your volume profile in 2018, which I don’t use much because I don’t understand it. But this TTM histogram column color is very useful. It is better if you can have the same for MACD histogram.
From the main menu on our website, select the Q&A forum. Open the Watch Lists topic and enter the term “MACD” in the search box. This link is what you get in the search results: https://www.hahn-tech.com/ans/cat/watchlists/?question_type=all&search=macd
Brilliant Thank you ! I wanted to use this for day trading Momentum stocks. Do you think a daily/60m/5m/1m would be the best timeframes ? Looking to have a Watchlist created form a scan that identifies sacking moving into “Blue Territory”
typos! .. should read “a watchlist created from a scan that identifies stocks moving into “Blue ” territory ” over a given set of timeframes
I have absolutely no opinion on what settings work best. I do not teach people to trade. I build tools to help traders get the information they need more efficiently.
How can I set up my TOS platform to show the charts the way you have them? That workspace looks like it is very productive in that it shows the main time frames all in one glance.
Thanks, exactly what I was looking for and works excellent!
also this basic function or
close is less than or equal to ParabolicSAR()
assignbackgroundColor(if Scan >=1 then color.BLUE else color.BLACK);
this is not working for me
how do i tell it to change color if the close is below or above standard parabolic SAR
Pete hi. Can please u help me fix this custom Stochastic fast watch list function
input price = CLOSE;
input length = 20;
input nK = 1.5;
input nBB = 2.0;
input alertLine = 1.0;
def stochasticFast = ( nK, nBB, ).stochasticFast;
plot stochasticFast = if stochasticFast>= 0 then
if stochasticFast> stochasticFast[1] then 2 else 1
else if stochasticFast = 0 then if stochasticFast > stochasticFast[1] then Color.CYAN else Color.BLUE else if stochasticFast = 0 then
if stochasticFast > stochasticFast[1] then color.CYAN else color.BLUE
else if stochasticFast < stochasticFast[1] then color.RED else color.YELLOW);
The appropriate place to post this request is here: https://www.hahn-tech.com/thinkorswim-forum-topics/
Hey Pete, great video. I followed it to the T and all the boxes on the wk,day and hour are all white. Did I do something wrong. I’m new to all of this. Thanks
A white background is not even included in the code, anywhere. So yeah, try to copy and paste that code again. Something is definitely not right.
I’m trying to get the color of the histogram from the 5 min chart but use it on a 1 min chart. I tried changing the aggregation period of CLOSE to 5 min, however it ignores this and only outputs the color of the histogram from the 1 min. Do you think there’s any way around this?
We cannot use secondary aggregation periods with licensed studies. There is is no workaround.